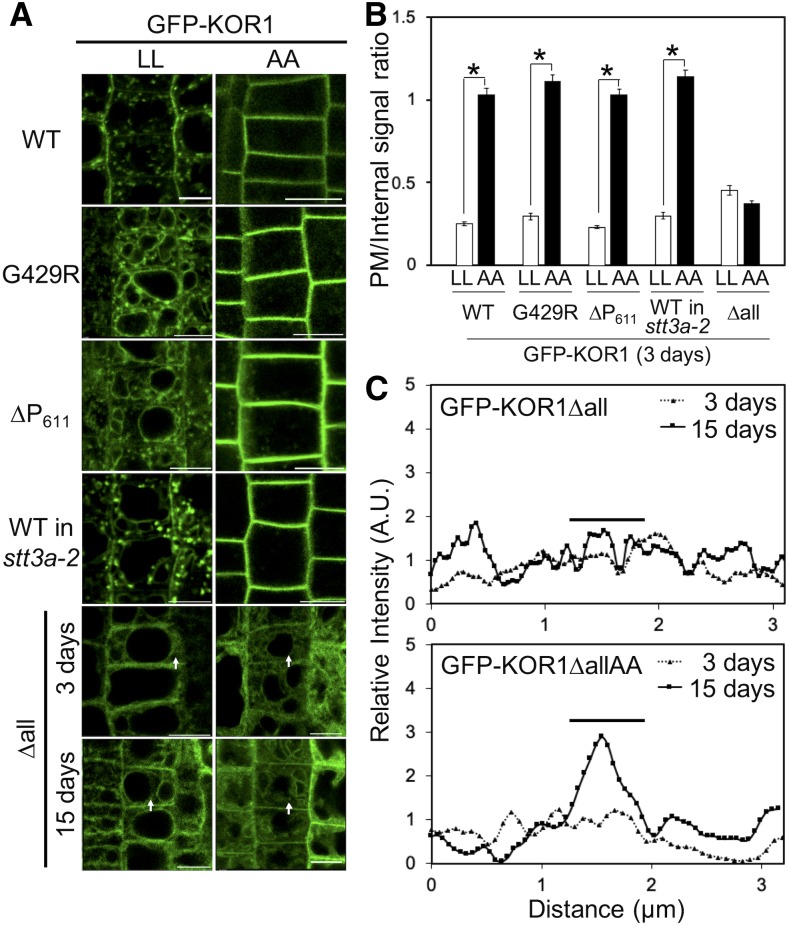
Figure 3.
Subcellular Localization of GFP-KOR1 Variants with Intact (LL) or Mutated (AA) Cytoplasmic LL Motif.
(A) Three-day-old plants of all lines and 15-d-old plants of KOR1∆all were used for observation. Bar =10 µm. WT, the wild-type GFP-KOR1.
(B) Quantitative data of (A), n = 30. The signal at the PM was divided by the internal signal of cells. Error bars represent the se of the mean (P < 0.01, Welch’s t test). WT, the wild type.
(C) Signal intensity of GFP-KOR1∆all and ∆allAA fluorescence along the arrows in (A). For relative intensity, each signal intensity was normalized by the average signal intensity of each genotype. The bars indicate the position of PM/cell wall. A.U. = arbitrary units.

