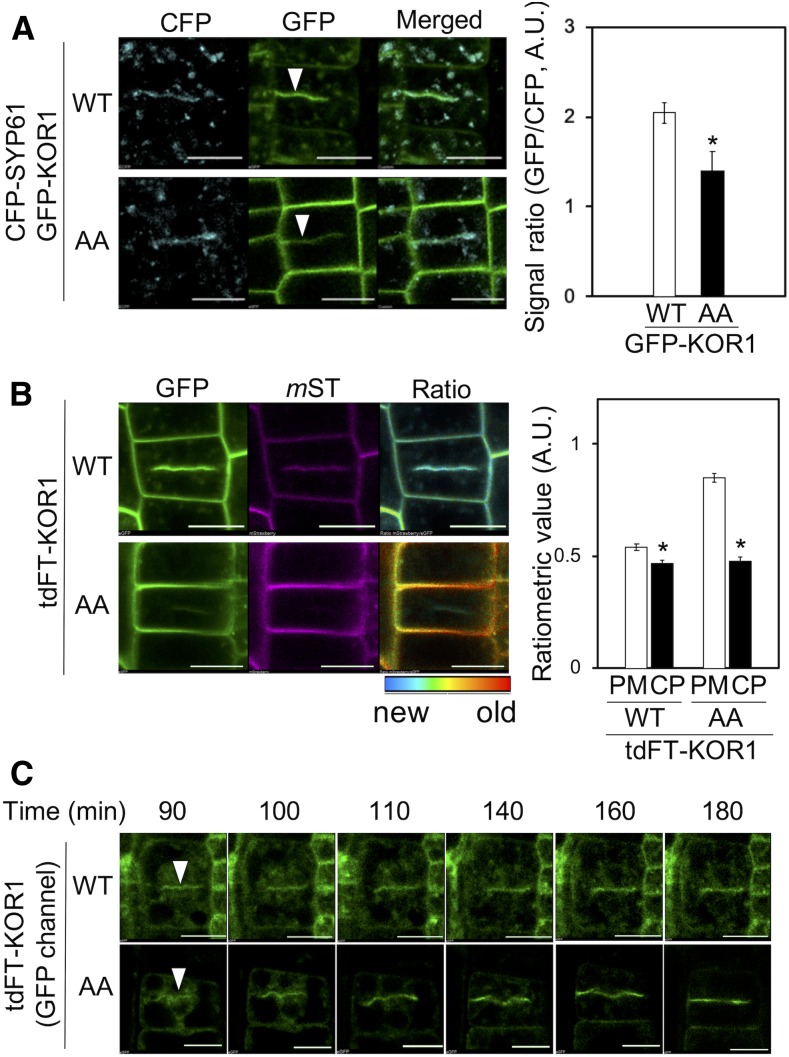
Figure 5.
Both GFP-KOR1 and GFP-KOR1AA Are Targeted to Cell Plates.
(A) GFP-KOR1 and GFP-KOR1AA colocalize with CFP-SYP61 at cell plates (white arrowheads). The graph shows the ratio of GFP and CFP at the cell plate (CP). A.U., arbitrary units; WT, the wild type.
(B) Ratiometric age analysis of de novo-synthesized tdFT-KOR1 and tdFT-KOR1AA at 6 hpi. For the quantification, values at the PM and CP were determined using the same method as described in Figure 2. Error bars represent the se of the mean (n = 10). The asterisks indicate significant differences to each value at the PM (P < 0.01, Welch’s t test). Bar = 10 µm. A.U., arbitrary units; WT, the wild type.
(C) De novo–synthesized tdFT-KOR1 and tdFT-KOR1AA are preferentially targeted to cell plates in dividing cells (white arrowheads). The time-course micrographs were taken starting from 90 min until 180 min after β-estradiol treatment. Only young KOR1 proteins (green fluorescence) were detected. WT, the wild type.

