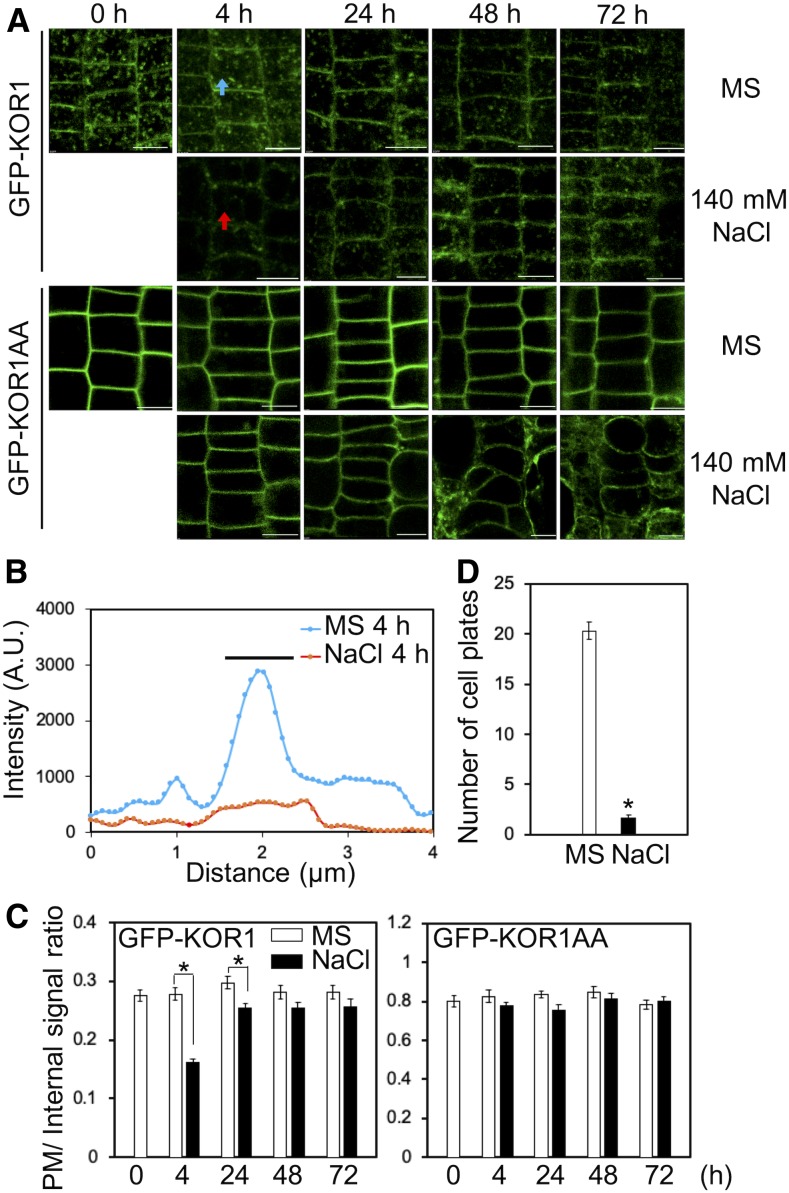
Figure 7.
Salt Stress Leads to Internalization of GFP-KOR1, but Not PM-Locked GFP-KOR1AA.
(A) Time-course observation of GFP-KOR1 and GFP-KOR1AA under salt stress. Three-day-old seedlings growing on a cellophane membrane placed on medium containing 1× MS salts and 3% (w/v) Suc were transferred to the same medium supplemented with no or 140 mM NaCl for the indicated period before root cells were imaged using a confocal microscope. Bar = 10 µm.
(B) Signal intensity of GFP-KOR1 fluorescence along the arrows across the PM in (A). The bar indicates the position of the PM/cell wall. A.U., arbitrary units.
(C) Quantitative data of (A), n = 50. The signal at the PM was divided by the internal signal of cells.
(D) Number of GFP-KOR1–positive cell plates per plant without or with 140 mM NaCl treatment for 4 h. Error bars represent the se of the mean (n = 30). The asterisks indicate significant differences between treatments (P < 0.01, Welch’s t test).

