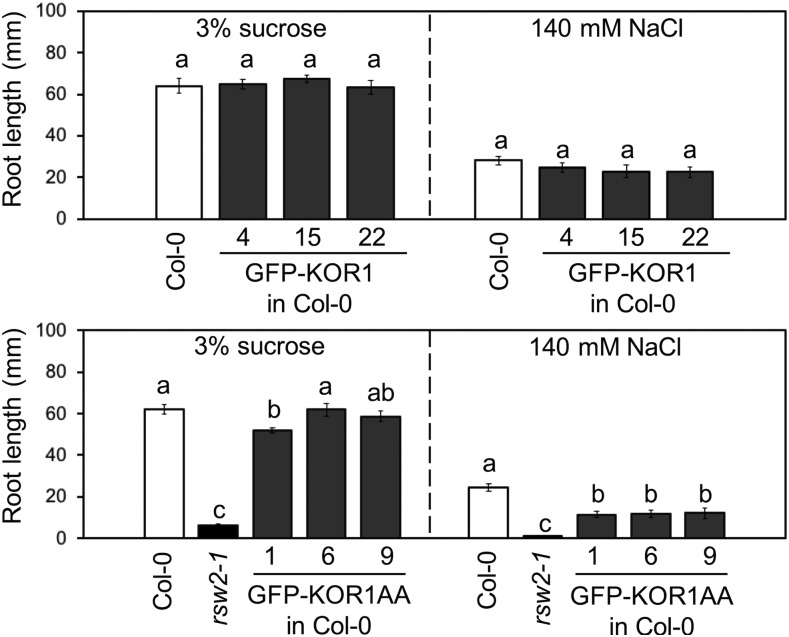
Figure 9.
Root Growth of GFP-KOR1 and GFP-KOR1AA in the Col-0 Wild-Type Background.
Experiments were conducted as described in Figure 6. The growth condition for each experiment is listed above each graph. Error bars represent the se of the mean (10 to 21 plants per line). Different letters show significant differences between genotypes (P < 0.05, one-way ANOVA followed by Tukey’s honestly significant difference post hoc test).

