Figure 1.
Transcriptional and Translational Responses of Roots to S. meliloti.
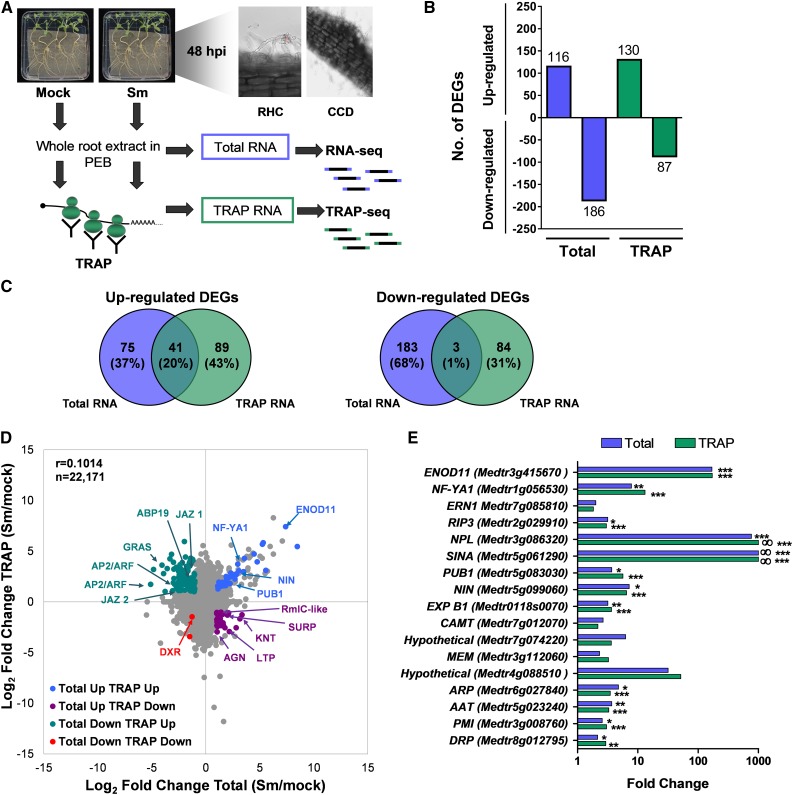
(A) Schematic overview of the experimental design. Roots of M. truncatula were inoculated with water (mock) or with S. meliloti (Sm). At 48 hpi, root hair curling (RHC) and cortical cell division (CCD) were observed. Whole root extracts were prepared in a buffer that maintains polysome integrity and subjected to total RNA extraction followed by RNA-seq or polysomal RNA isolation by TRAP, also followed by RNA-seq (TRAP-seq) to characterize changes in the transcriptome or the translatome, respectively. Two completely independent biological replicates (experiments performed on different days) were obtained using root tissue from more than 100 plants per experiment and condition.
(B) Number of genes differentially regulated in Total and TRAP samples (FC ≥ 2 and ≤0.5, P < 0.05 as identified by Cuffdiff).
(C) Venn diagrams illustrating the limited overlap between significant DEGs in Total and TRAP RNA samples.
(D) Scatterplot showing the FC in total and TRAP samples in response to rhizobia. Comparison of total RNA samples from mock (water-inoculated) versus Sm-inoculated roots and of TRAP RNA samples from mock versus Sm-inoculated roots. Each dot represents the log2 of the FC in total and TRAP samples. DEGs are shown as colored dots. Selected genes are indicated: ENOD11 (Medtr3g415670), NF-YA1 (Medtr1g056530), NIN (Medtr5g099060), PUB1 (Medtr5g083030), GRAS (Medtr4g122240), AP2/ERF1 (Medtr4g086190), AP2/ERF2 (Medtr4g086165), jasmonate zim-domain protein1 (JAZ1, Medtr5g013520), JAZ2 (Medtr5g013530), Auxin Binding Protein19 (ABP19, Medtr2g019780), DXR (1-deoxy-d-xylulose 5-phosphate reductoisomerase, Medtr8g012565), Agenet domain protein (AGN, Medtr5g089140), Lipid Transfer Protein (LTP, Medtr7g094650), knotted 1 binding protein (KTN, Medtr4g118050), RmlC-like cupins superfamily protein, (Rmc-like, Medtr2g072560), and SURP and G-patch domain protein (SURP, Medtr8g036255).
(E) FCs in the transcriptome or the translatome of symbiotic marker genes. Values represent the ratio of the FPKM mean values of rhizobium-inoculated samples/FPKM mean values of mock-inoculated samples of two biological replicates. Asterisks indicate statistically significant differences (*P < 0.05, **P < 0.01, ***P < 0.001) according to Cuffdiff parameters. ∞ indicates that FPKM values in mock-inoculated samples were zero or near zero. Full name and references for these genes can be found in Supplemental Data Set 8.

