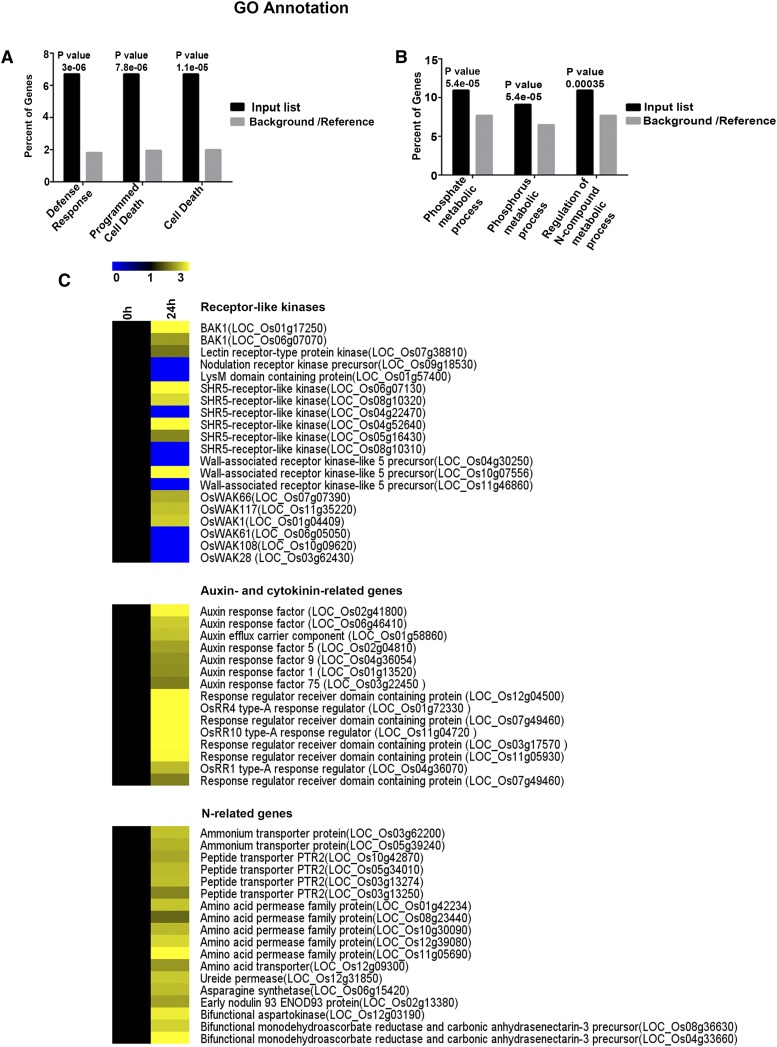
Figure 2.
DEGs in Rice in Response to R. mucilaginosa JGTA-S1.
(A) and (B) Downregulated (A) and upregulated (B) DEGs in rice roots at 24 hpi were subjected to AgriGO singular enrichment analysis, and enriched categories for biological function were plotted. The P-values indicating significance are listed above the bars; “e” denotes the scientific notation for power of 10. GO, Gene Ontology.
(C) Heatmap of the expression patterns of various genes.

