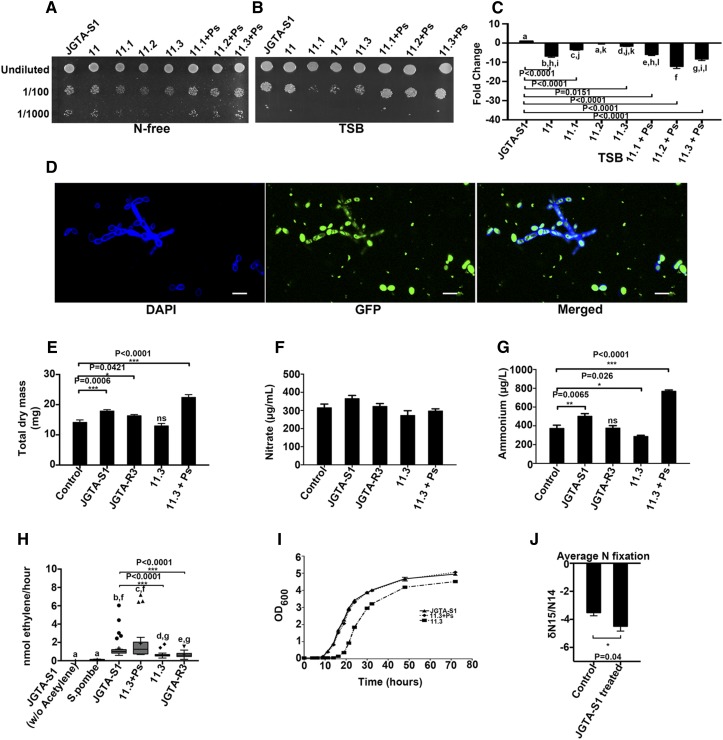
Figure 7.
JGTA-S1 Fixes N in Planta, and the Endobacterium P. stutzeri Regulates Plant Biomass and Ammonium Levels.
(A) and (B) Growth of JGTA-S1 and its derived strains 11.3 and 11.3+Ps was compared in (A) N-free medium and (B) N-replete TSB.
(C) Relative numbers of Pseudomonas/JGTA-S1 cell in these strains were measured by qPCR. Cells were grown in TSB as described in Methods, and relative levels of P. stutzeri 16S rDNA gene were quantitated against JGTA-S1 GAPDH as a reference gene.
(D) JGTA-S1 treated with FK506 incubated with GFP-labeled P. stutzeri-JGTA-R3 for 20 h. P. stutzeri outside the yeast was killed with tetracycline and Timentin, followed by confocal microscopy. The effects of JGTA-S1, P. stutzeri-JGTA-R3, 11.3, and 11.3+Ps on plant growth and inorganic N content were analyzed. Rice plants were treated with 1× MS (control), JGTA-S1, P. stutzeri-JGTA-R3, 11.3, and 11.3+Ps, and plant parameters were measured at 4 wpi. Bar = 10 µm. DAPI, 4′,6-diamidino-2-phenylindole.
(E) to (G) Total dry mass (E), nitrate content (F), and ammonium content (G). Statistical comparisons for nitrate content were performed using one-way analysis of variance with Tukey’s post hoc test (n = 3). Statistical comparisons for ammonium content (n = 6) and dry mass (control, n = 16; JGTA-S1 treated, n = 24; 11.3 treated, n = 14; 11.3+Ps treated, n = 14; JGTA-R3 treated, n = 24) were performed using Kruskal-Wallis nonparametric test followed by Dunn’s post correction test.
(H) JGTA-S1, 11.3, 11.3+Ps, and P. stutzeri-JGTA-R3 were grown in N-free medium. The OD of the cells was normalized prior to the acetylene reduction assay. S. pombe (a nondiazotrophic yeast strain) and JGTA-S1 without acetylene injection were used as negative controls. Statistical analysis was performed using the Kruskal-Wallis nonparametric test followed by Dunn’s post correction test (JGTA-S1 without acetylene, n = 10; S. pombe, n = 10; JGTA-S1, n = 32; 11.3, n = 31; 11.3+Ps, n = 27; P. stutzeri-JGTA-R3, n = 31).
(I) For the growth curve, JGTA-S1, 11.3, and, 11.3+Ps were grown in N-free medium, and OD600 was measured at different time points. Mean ± se was calculated for each time point.
(J) δ15N stable isotope analysis of rice plants treated with MS (control) and JGTA-S1. Values obtained were statistically analyzed using Student’s t test (P ≤ 0.05, n = 6). Data are given as mean ± se.

