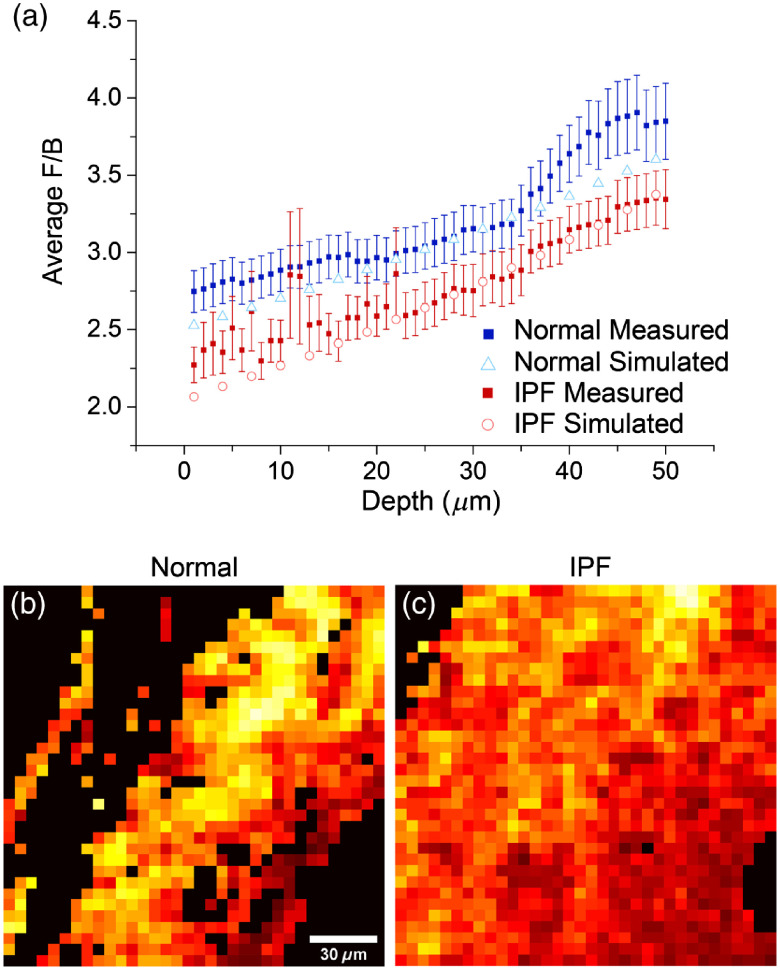
Fig. 4.
Local analysis of the SHG emission directionality. (a) Measured F/B as a function of depth into normal (blue) and IPF (red) tissues; solid and open symbols correspond to measured and simulated responses, respectively. The resulting in patches for (b) normal and (c) IPF tissues. Number of stacks were 34 and 75 for IPF and normal, respectively. .

