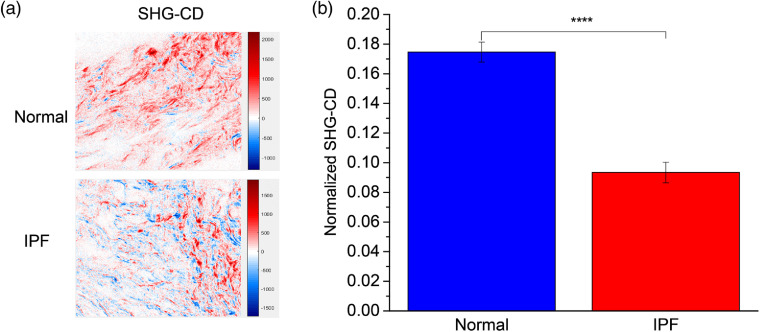
Fig. 6.
(a), (b) Normalized SHG-CD data of cleared normal (blue) and IPF (red) lung tissues measured at 780-nm excitation wavelength. (a) The red and blue correspond to positive and negative SHG-CD values, respectively, which are determined by the fiber polarity. (b) Standard error bars are shown. Number of unique images were 134 and 121 for IPF and normal, respectively. . Note: **** represents .

