Fig. 1.
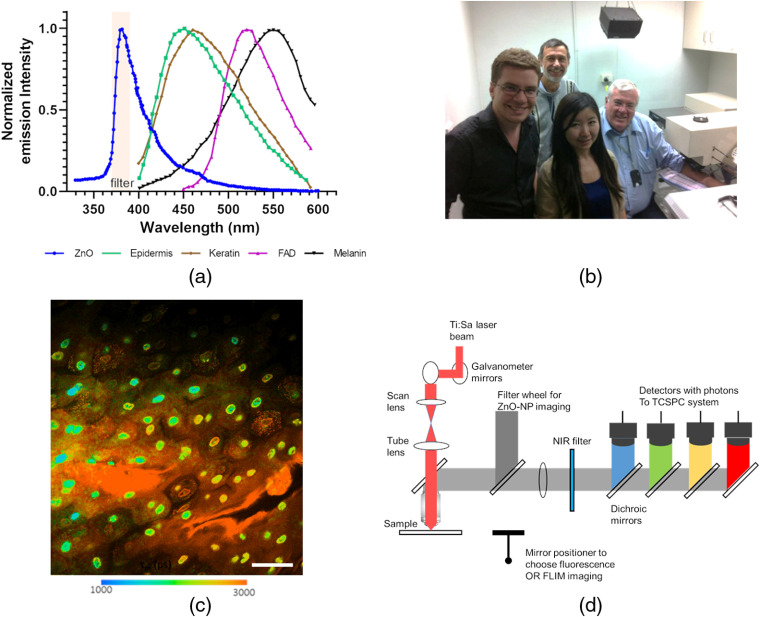
Essentials of MPM-spectral-FLIM skin imaging. (a) Emission spectra for main endogenous fluorophores in the skin and for nano zinc oxide. (Redrawn with permission from Ref. 8.) (b) Skin imaging using the DermaInspect® system in the Therapeutics Research Center at University of Queensland (UQ). (c) Typical high-resolution image of viable epidermal cells after acriflavine treatment with the DermaInspect®, color-coded to visualize mean fluorescence lifetime, . Scale bar is . (d) Schematic of detectors in the DermaInspect® based at UQ.

