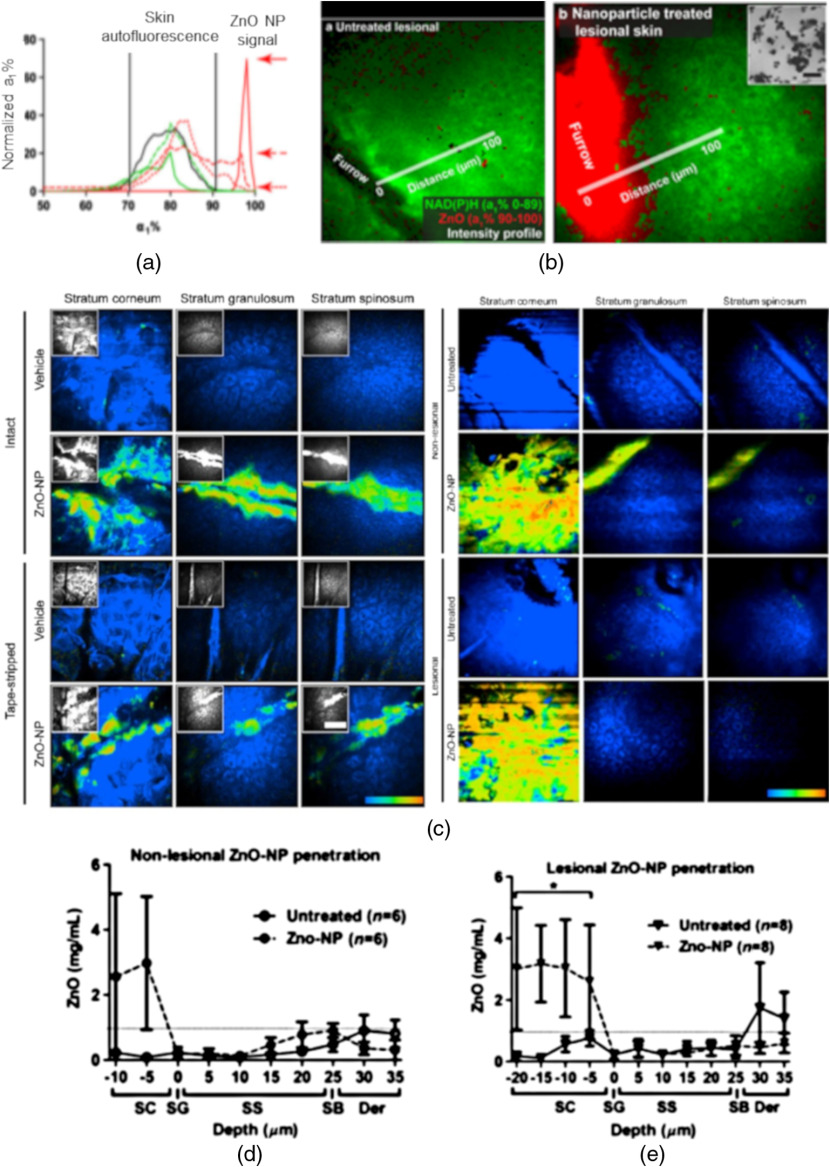
Fig. 4.
(a) Distinct signals from skin autofluorescence and ultrafast ZnO NP MEP. (a) The solid red line and red arrows indicate the maximal ZnO NP intensity of ZnO NP alone and after 4 and 24 h on the surface of the skin. (b) (left) Images of ZnO NP zinc oxide nanoparticles untreated lesional psoriatic skin, (right) autofluorescence (green) and ZnO NP (red) aggregate in skin furrows with of sunscreen-treated lesional sites based on . The inset (in right panel) is an electron microscopy image of the individual ZnO NP with a mean diameter of 35 nm. Scale bar is 100 nm (adapted with permission from Ref. 42). (c) In vivo MP-FLIM images of intact, tape-stripped, nonlesional, and lesional volunteer skin at different depths after 24 h treatment.12 These color images depict the autofluorescence as blue ( 0 to 85) and ZnO NP as green-red ( 90 to 100) in volunteer skin. The gray scale insets are intensity-only images. Scale bar is . (d), (e) ZnO NP penetration profiles, excluding furrows, in (d) nonlesional and (e) lesional volunteer skin, using 90 to 100 normalized to the region of interest area to quantify ZnO NP signal (adapted with permission from Ref. 12). * value of when compared with untreated skin.

