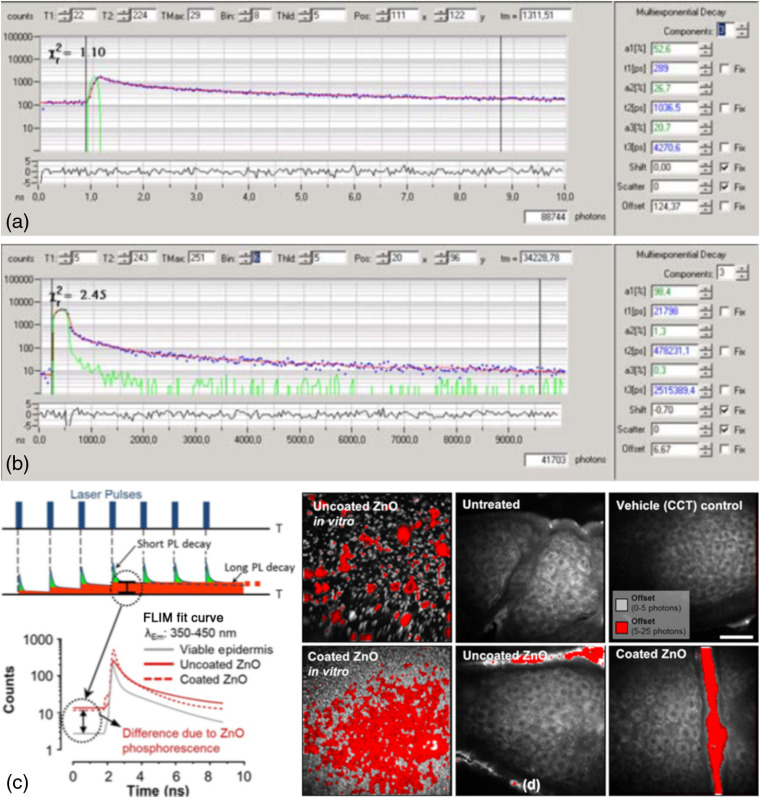
Fig. 5.
Fluorescence decay fit curves of ZnO NP: (a) fast decaying photoluminescence collected over 10 ns and (b) direct lifetime measurement using phosphorescence lifetime imaging (PLIM) collected over . Reproduced with permission. (c) The enhanced background signal seen at is related to the ZnO NP concentration where the signal has accumulated due to the repeated laser pulsing to create an “offset” that results in a more sensitive multicomponent fit of the data. The multicomponent fit of PLIM is less sensitive because there is loss of photons over a longer period, up to when the decay returns to background conditions. (d) Schematic of the ZnO NP lifetimes as quantified by a quasicontinuous accumulation of steady-state photoluminescence. (d) Representative multiphoton images of uncoated and coated ZnO NP in vitro and topically applied to in vivo human skin for 6 h for signal isolation and quantification. “Offset” values counts are shown in grayscale and include cellular autofluorescence, while “offset” values above the autofluorescence- “offset” level were assigned to ZnO NP (red). . With permission from Refs. 11 and 46.

