Fig. 2.
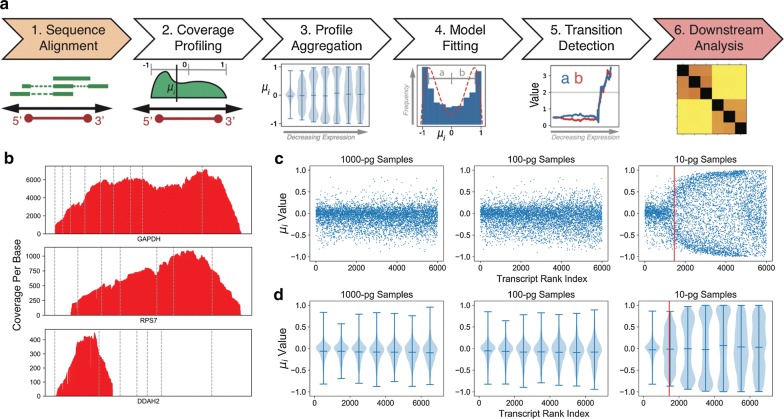
CLEAR Workflow: bin-based coverage analysis by transcript expression. a Data analysis workflow using CLEAR to preprocess lcRNA-seq data. Step 1: Trimmed lcRNA-seq reads are aligned to the reference genome; Step 2: μi, the mean of the positional distribution of aligned reads along each individual transcript, is determined; Step 3: Transcript positional means, μi, (y-axis) are ranked and then binned by the transcript read coverage (x-axis). When μi of a bin is ≈ 0, the read distribution is symmetrical along the length of the transcript. When μi within a bin develops a bimodal distribution with a mode toward + 1 (TTS) and − 1 (TSS), its values will deviate from 0; Step 4: All available transcripts, binned into groups of 250 are fitted to a bimodal distribution model. The emergence of a bimodal distribution identifies when aggregate μi start to deviate from a unimodal distribution around the center of the transcripts, indicated by a change in the fitting parameters a and b; Step 5: When either of the model parameters exceed a value of 2 (indicated by a gray line), transcripts beyond that point are excluded by CLEAR for differential gene expression and other downstream analysis; Step 6: CLEAR transcripts are used in downstream between-group analyses such as hierarchical clustering; b example lcRNA-seq read coverage plots. Read coverage plot for GAPDH depicts a transcript with μi ~ 0, RPS7 depicts a transcript close to the CLEAR cutoff, while DDAH2 depicts a transcript deemed too noisy by CLEAR; c CLEAR profiles for 10-, 100- and 1000-pg input mass lcRNA-seq data. The value of μi is plotted for the 7000 highest expressed primary transcripts for three representative samples. The red line depicts the CLEAR filtering threshold; d violin plots of the same data as shown in c. The end marks indicate the window extrema and the middle bar indicates the mean

