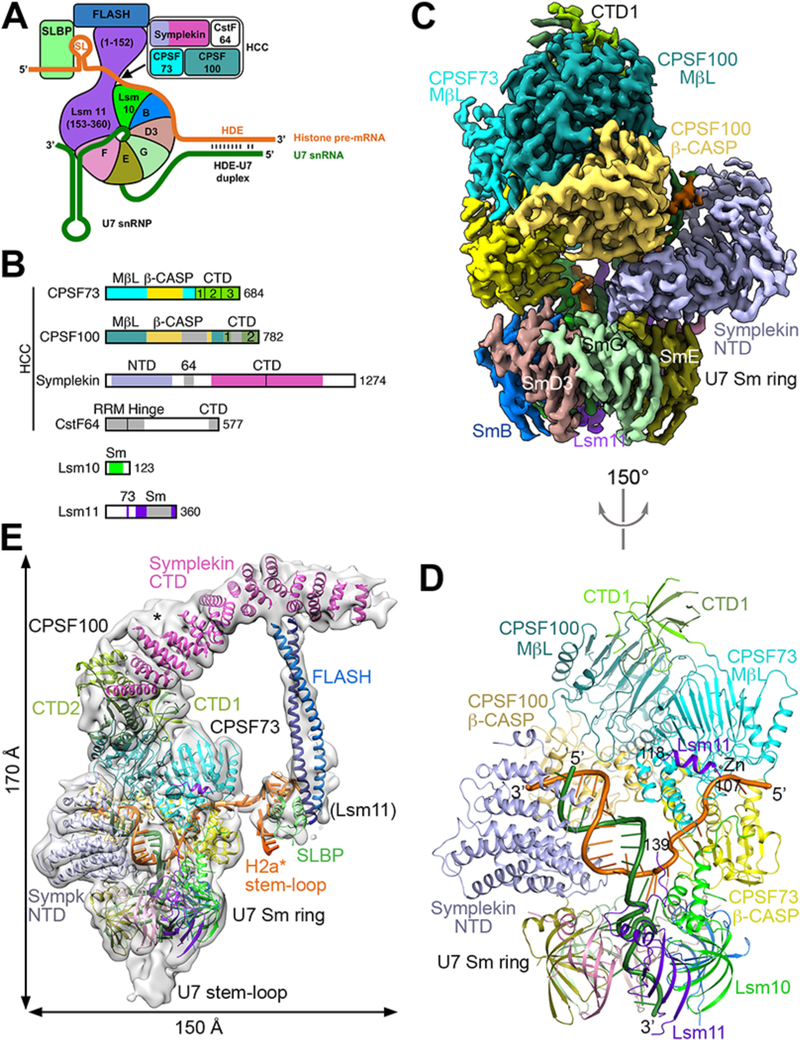
Figure 1. Overall structure of the human histone pre-mRNA 3′-end processing machinery.
(A) Schematic drawing of the histone pre-mRNA 3′-end processing machinery. (B) Domain organizations of the subunits of HCC, and Lsm10 and Lsm11. The domains in CPSF100 are given slightly darker colors compared to their homologs in CPSF73. The vertical bar in the symplekin CTD marks its N-terminal half that interacts with CPSF73. Abbreviations are defined in table S1. (C) Cryo-EM density at 3.2 Å resolution for the core of the machinery. (D) Schematic drawing of the structure of the core of the machinery, viewed after a 150° rotation around the vertical axis from panel C. The proteins are colored as in Figs. 1A,1B. The U7 snRNA is in dark green, and H2a* in orange. (E) Cryo-EM density for the entire machinery (gray), low-pass filtered to 8 Å resolution to show the density of FLASH and SLBP. The possible density for CTD3 of CPSF73 is indicated with the asterisk. Structure figures are produced with PyMOL (www.pymol.org) unless noted otherwise. Panels C and E produced with Chimera (30).

