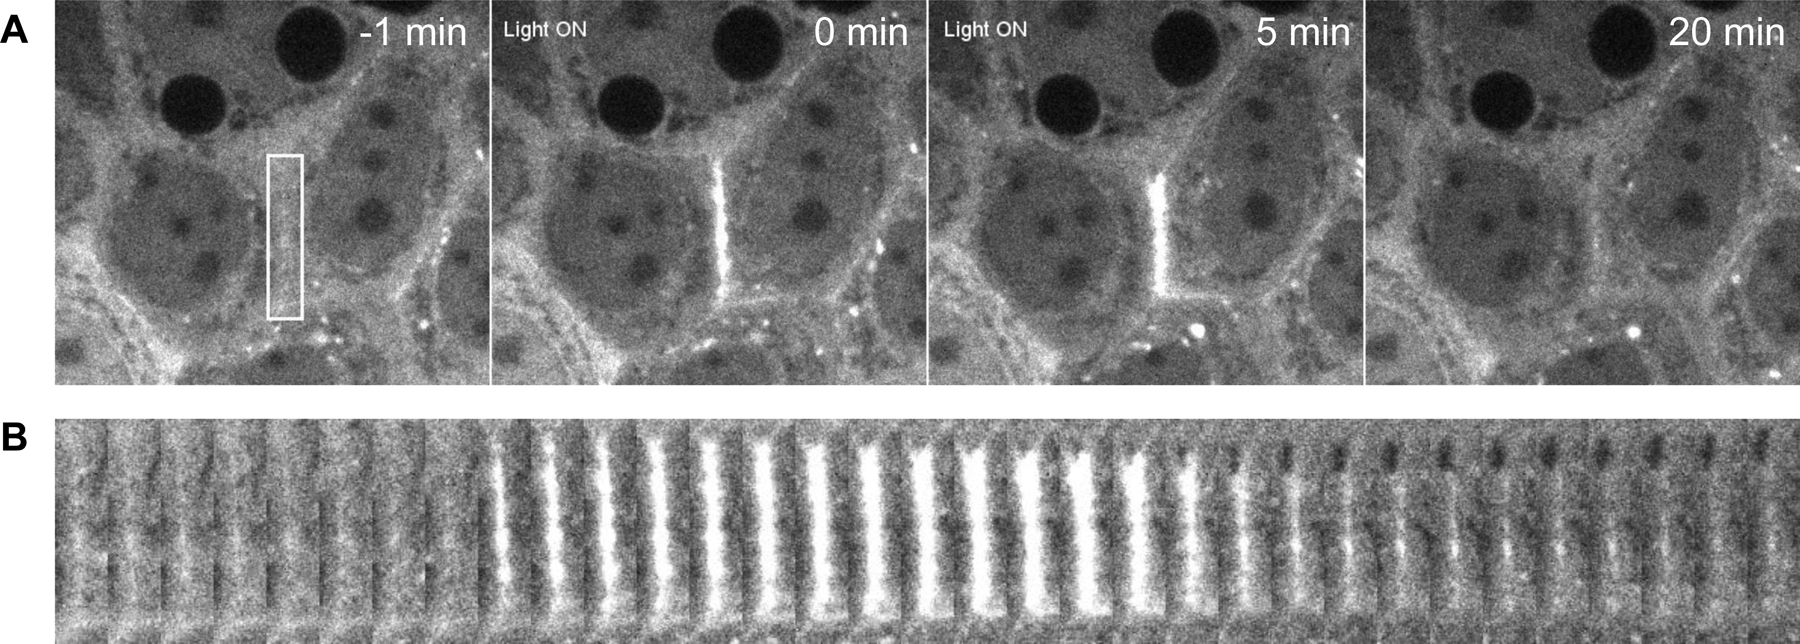
Figure 5:

A) Representative images of a stable optogenetic cell line expressing 2xPDZ-mCherry-LARG before, during, and after targeted junctional optogenetic activation. Image shows ROI of activation (White box) inducing junctional localization of the GEF and shortening of the targeted junction over a 5 minute activation, with a 15 minute relaxation period showing reversal of any junction contraction. B) Representative kymograph showing expression of the 2xPDZ-mCherry-LARG before, during, and after targeted junctional activation.
