
Figure 1.
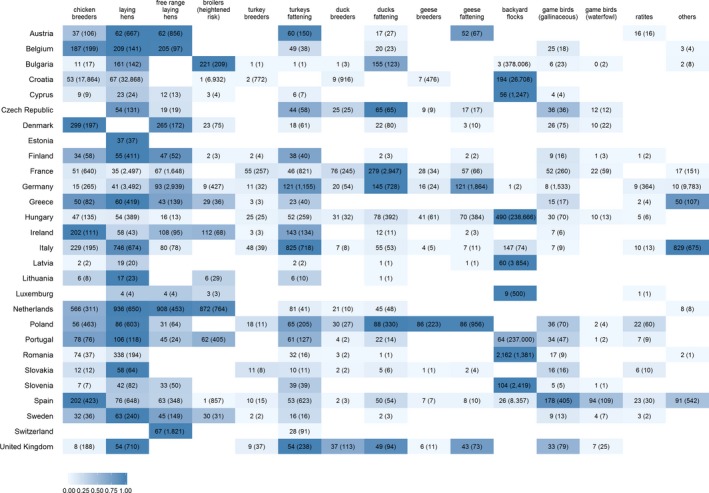
Total number of poultry establishments (PE) sampled, and maximum number of PE reported at any of the two reporting periods for the regions where sampling took place (brackets), presented by RC and poultry category. A scale of blue (going from darker to lighter blue colours) is used to highlight poultry categories with the largest number of PE sampled per RC