Figure 2.

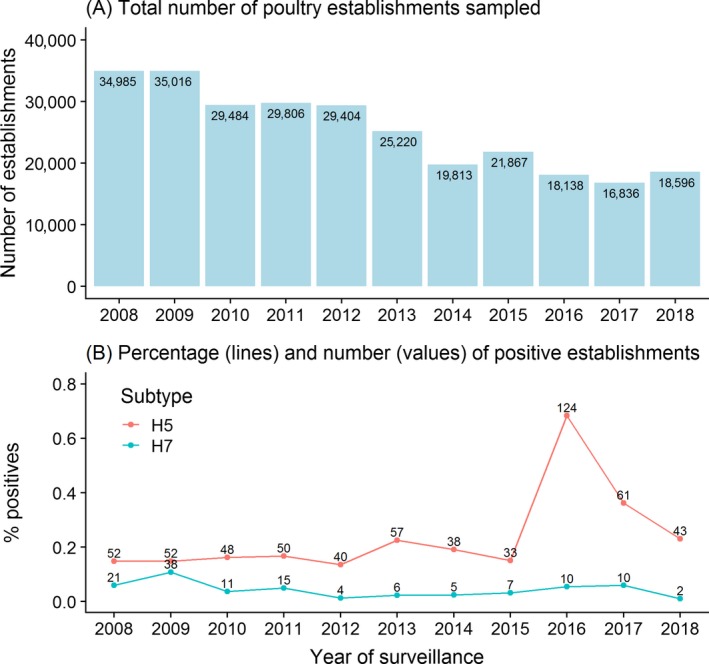
(A) Total number of poultry establishments sampled per year and (B) line graph of the percentage of the AI seropositive establishments of the H5 (red line) and H7 subtypes (blue line), with the number of seropositive establishments shown per year
