
Figure 4.
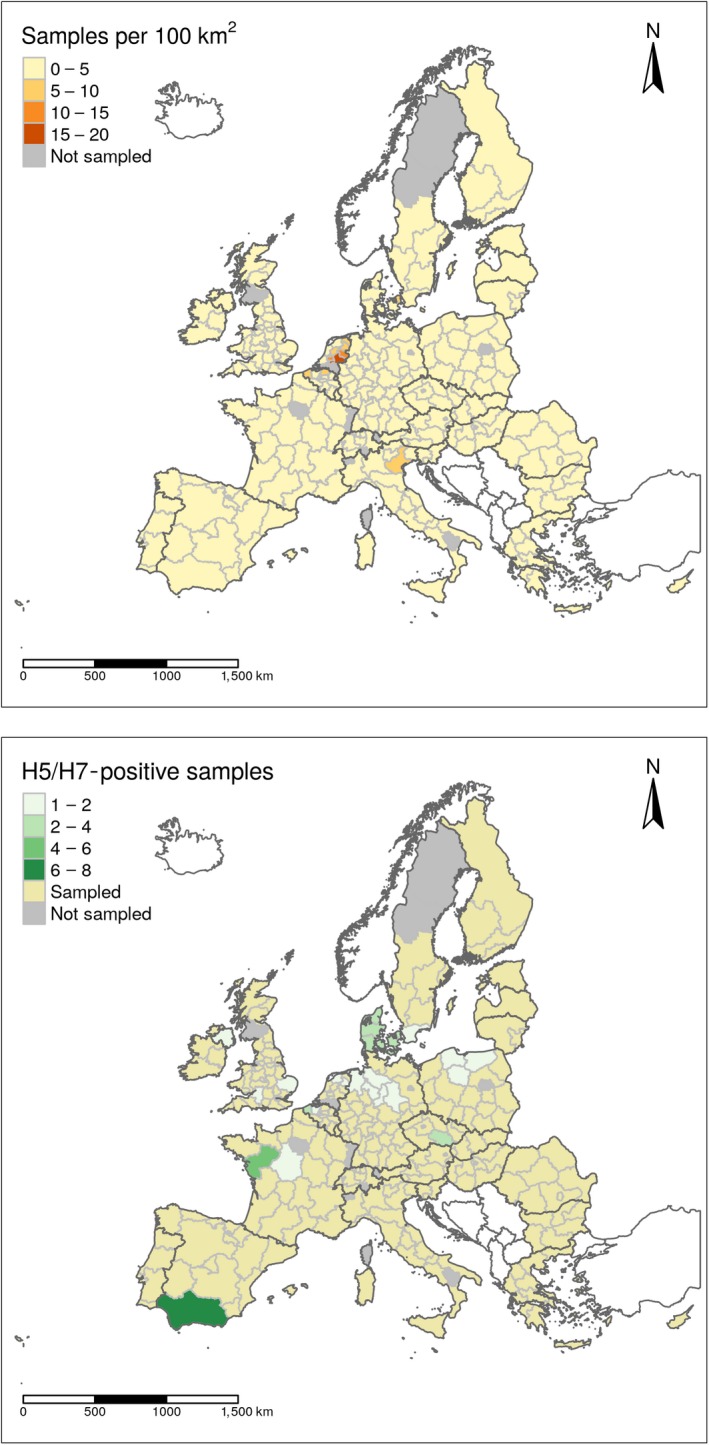
Sampling density expressed as the number of establishments sampled per 100 km2 (upper map) and geographical distribution of AI H5 and H7 seropositive establishments (lower map) showed at NUTS 2 level. Countries which are not part of the EU are shown in white (excluding Switzerland)