
Figure 5.
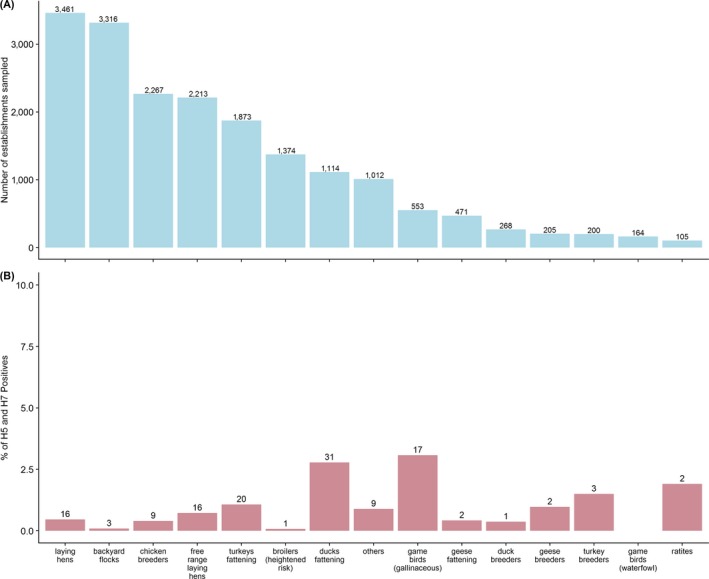
(A) Total number of establishments sampled by poultry category with values above the bars referring to the number of establishments sampled; (B) percentage (y‐axis) and number (above bars) of establishments sampled that tested serologically positive to H5 or H7 AI virus by poultry category