
Figure 10.
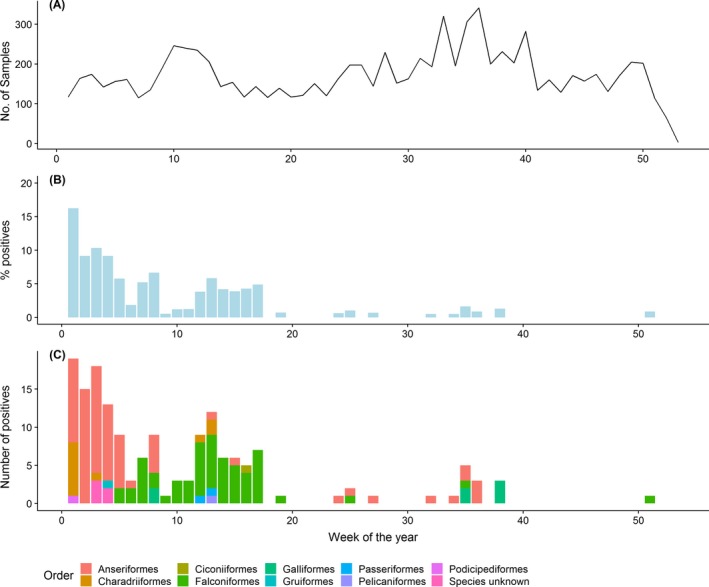
Temporal distribution of wild birds sampled via passive surveillance and reported by RC in 2018. (A) Weekly number of wild birds sampled by passive surveillance. (B) Percentage of positive HPAI infected wild birds. (C) Weekly number of HPAI detections colour coded by the taxonomic order of the infected birds