
Figure 13.
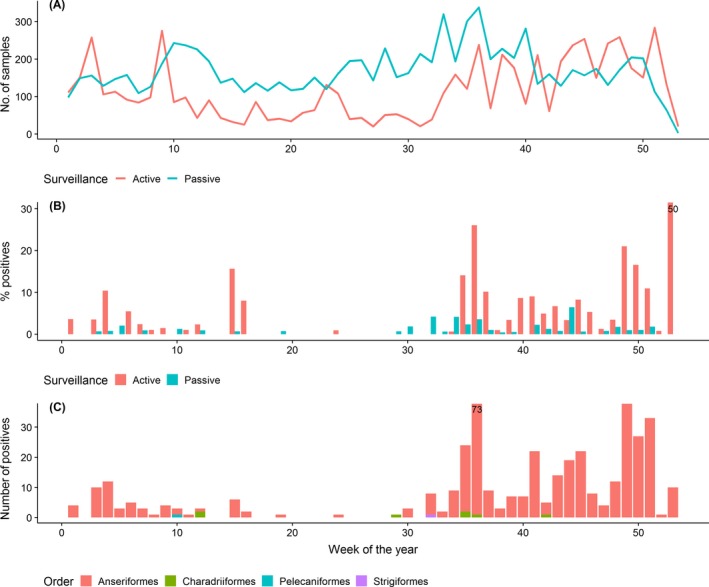
(A) Weekly number of wild birds sampled by both, passive and active surveillance, (B) weekly percentage of LPAI‐positive wild birds found, and (C) weekly number of LPAI‐positive wild birds by taxonomic order. A truncated Y‐axis was used in graphs B and C; for observations exciding the limits of the Y‐axis, values are provided as labels