
Figure 4.
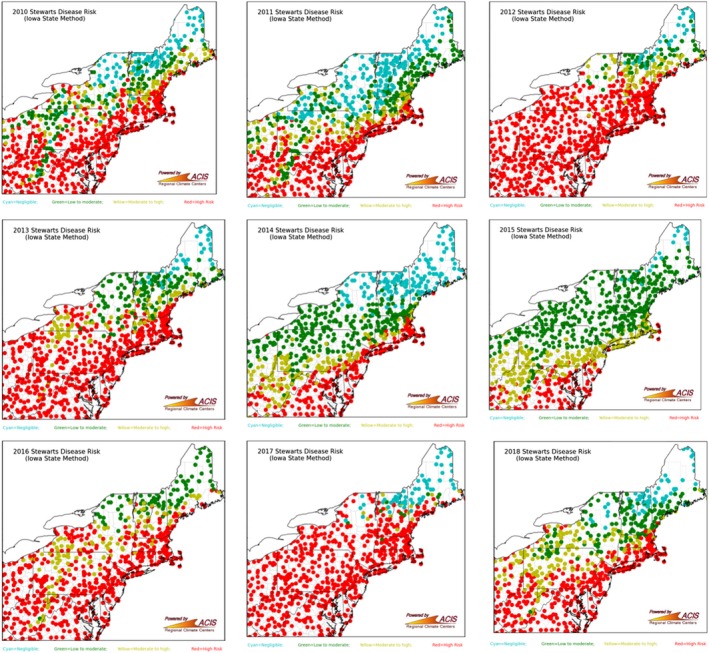
Maps of Stewart's wilt risk in New York State and surrounding regions (2010‐2018), based on the Iowa State University Model. The model predicts the prevalence of Stewart's wilt based on average temperatures for the months of December, January and February. Warm winter temperatures suggest that survival of large corn flea beetle populations is likely. Therefore, a high disease prevalence (red dots on map) is predicted if the mean monthly temperatures for December, January and February are each above 24°F (−4.4°C). If two of the three months average above 24°F, the risk is moderate to high (yellow dots on map). If one of the three months averages above 24°F, the risk is low to moderate (green dots on map). If all three months average below 24°F, survival of the beetle is unlikely and the risk of disease is negligible. With kind permission of the Network for Environment and Weather Applications and the Northeast Regional Climate Center, both at Cornell University, USA. Available online at: http://newa.cornell.edu/index.php?page=sweet-corn