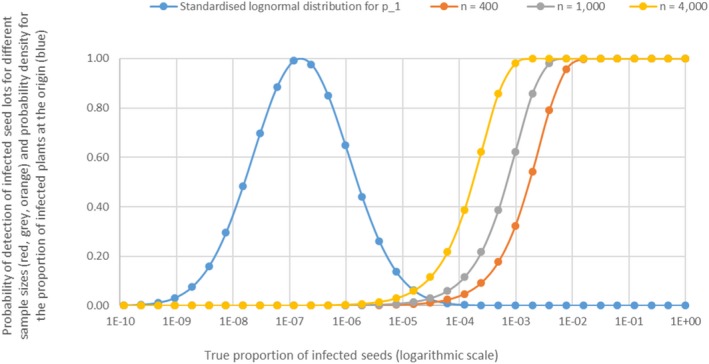
Figure 6.

Probability distribution for the proportion of infected plants at the origin (p1) (blue) and probability of detection of infection when a sample of 400 (red), 1,000 (grey) and 4,000 (orange) seeds is tested using standard procedures, assuming 100% sensitivity of the test (p3)
