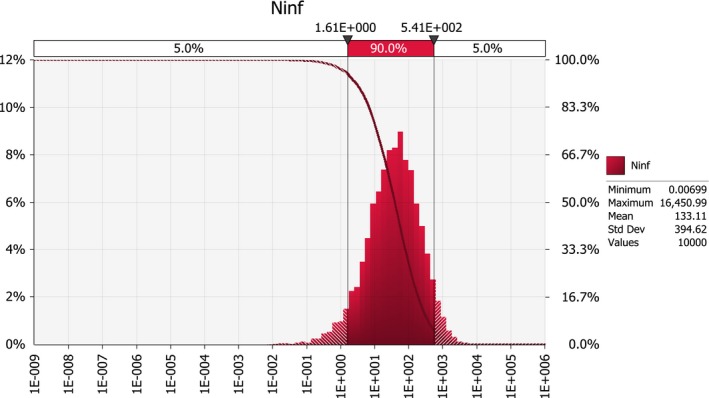
Figure 19.

Outcome of the model simulations for scenario A2b (relative frequency and cumulative descending probability; x‐axis on a log scale; same scale as in Figures 17, 18, 20 and 21). The number of infected maize seedlings growing in the EU due to import of USA seed per year is between about 1.6 and about 540 with a 90% probability
