
FIGURE 1.
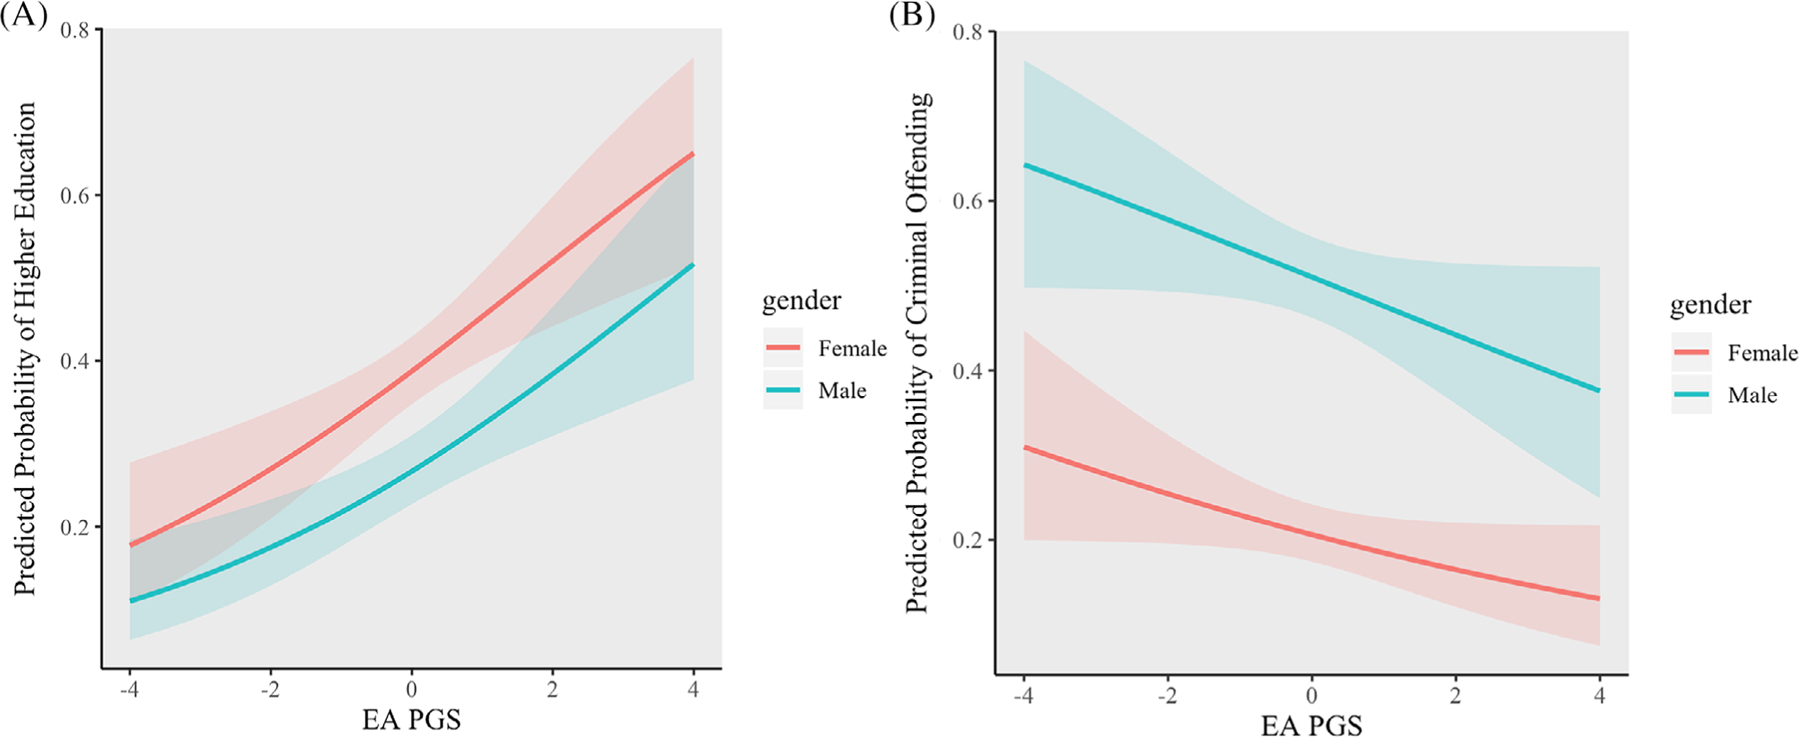
Probability of (A) higher education and (B) criminal offending based on participants’ EA PGS and gender adjusted for intervention status. The EA PGS included in the analyses was regressed on the 10 genetic ancestry principal components
Official websites use .gov
A
.gov website belongs to an official
government organization in the United States.
Secure .gov websites use HTTPS
A lock (
) or https:// means you've safely
connected to the .gov website. Share sensitive
information only on official, secure websites.
Probability of (A) higher education and (B) criminal offending based on participants’ EA PGS and gender adjusted for intervention status. The EA PGS included in the analyses was regressed on the 10 genetic ancestry principal components