
Fig. 5.
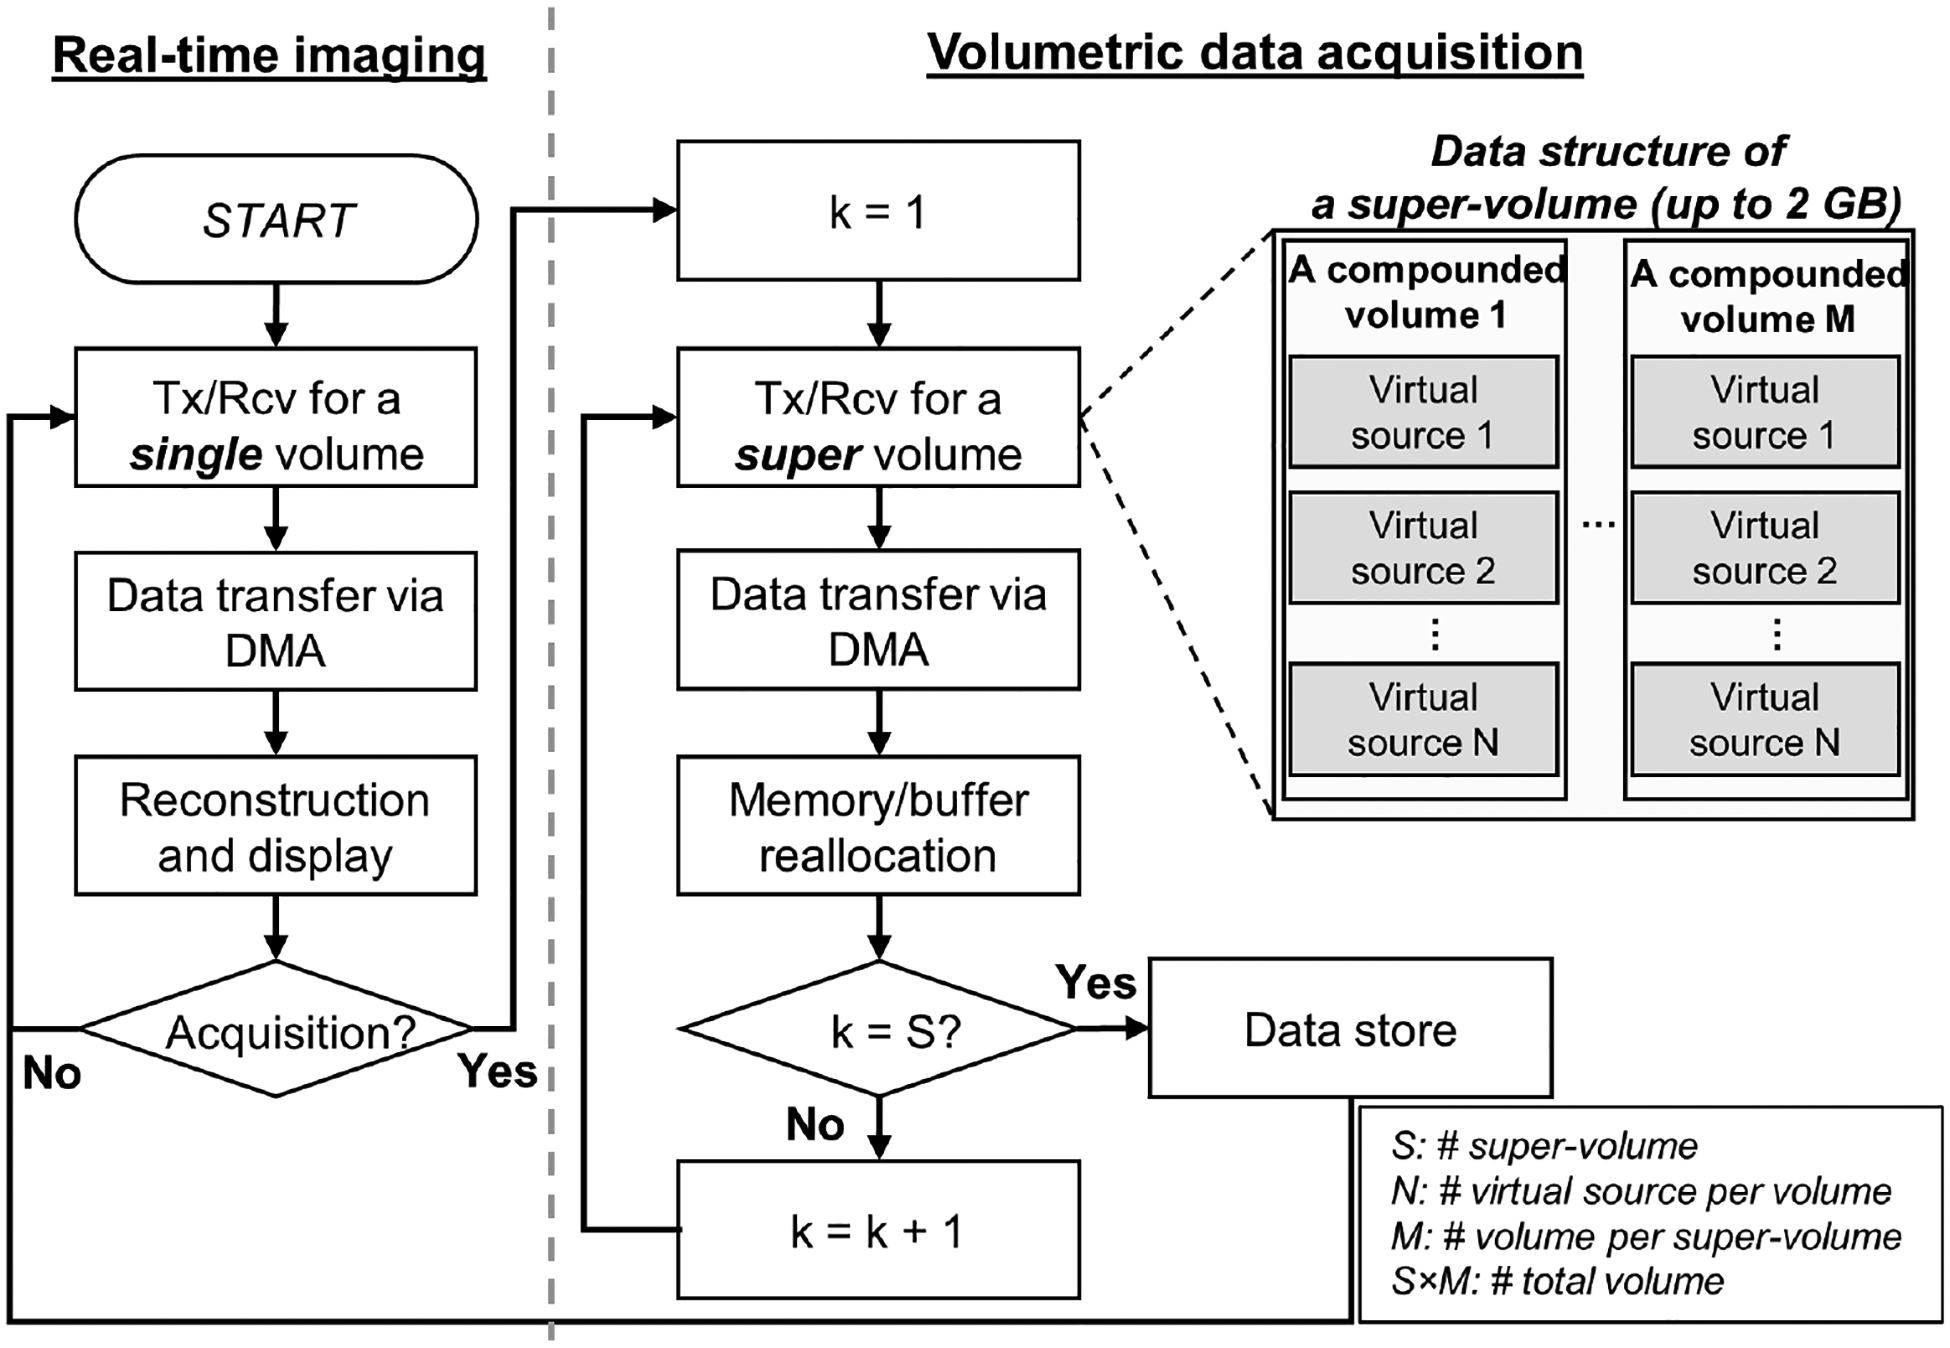
The flow chart for the developed sequence for volumetric data acquisition. Two imaging modes are provided. Live image reconstruction & visualization is omitted in the data acquisition mode. Tx: Transmit, Rcv: Receive, S: the number of super-volumes, N: the number of virtual sources per volumes, M: the number of volumes in a super-volume. S×M: the number of total volumes, S×M×N: the number of total Tx/Rcv acquisition events.