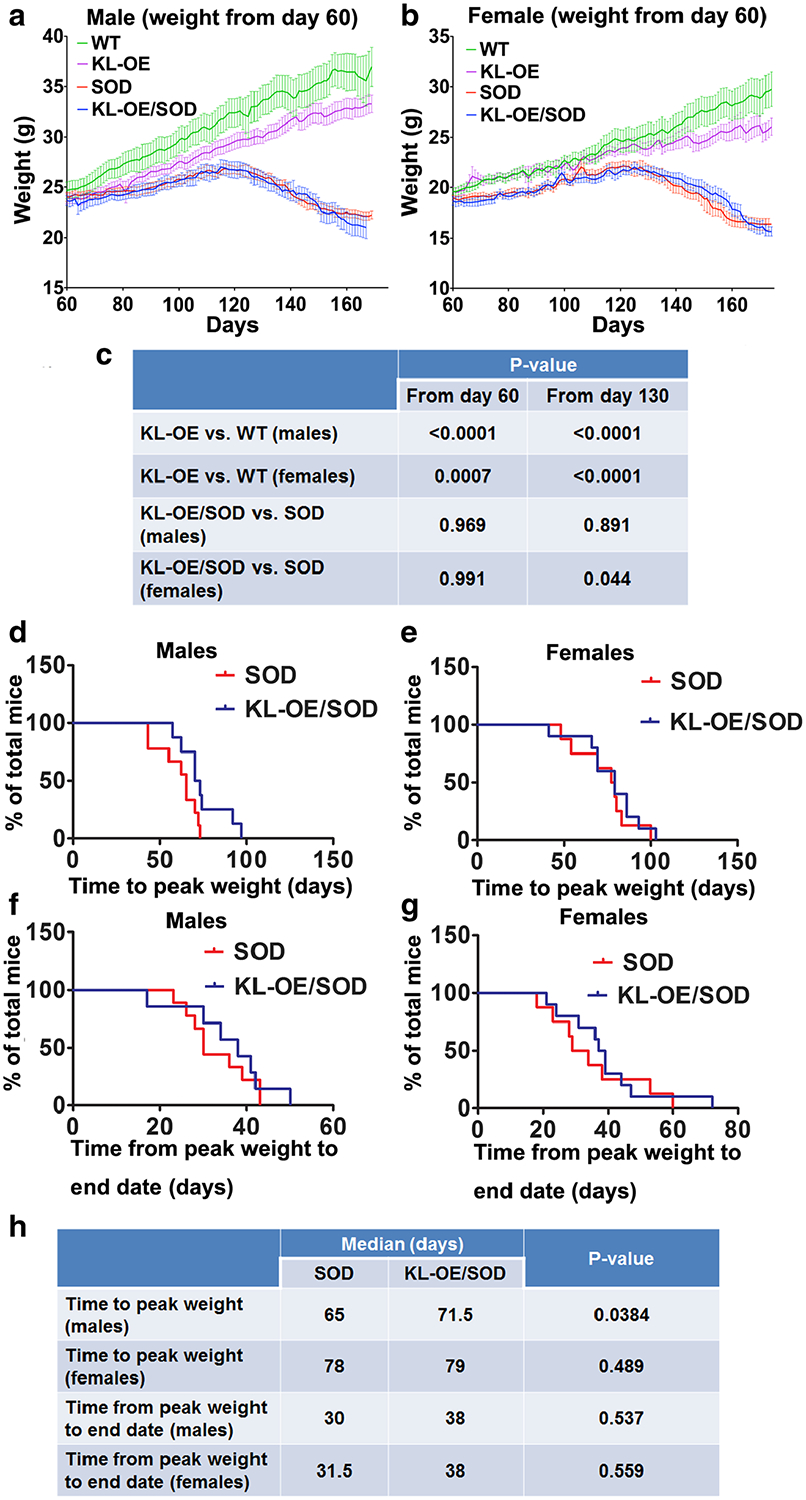
Fig. 2.

Mean group body weight plotted for male (a) and female (b) mice over time starting from age day 60 (a, b) until the date of last death within each group. Since mice within each individual group died at different ages, the terminal weights for all mice were carried forward for the calculation of the mean values of the group to prevent decomposition of the mean at final stages. c Results of the statistical analysis of one-way ANOVA with post hoc Tukey’s test. d, f Kaplan–Meier survival plot for time (in days) to reach peak weight (as a sign of the onset of the disease) in males (d) and females (e). f, g Kaplan–Meier survival plot for time (in days) from the peak weight to end stage (as a sign of the progression of the disease) in males (f) and females (g). h Results of statistical analysis of log-rank (Mantel–Cox test). The time for the detection of peak body weight for individual mice was assessed after spline smoothing of each mouse’s weight over time using Excel software. In cases where individually smoothed weight curves had numerous equal peaks in weight, the final peak time point was taken for the analysis.
