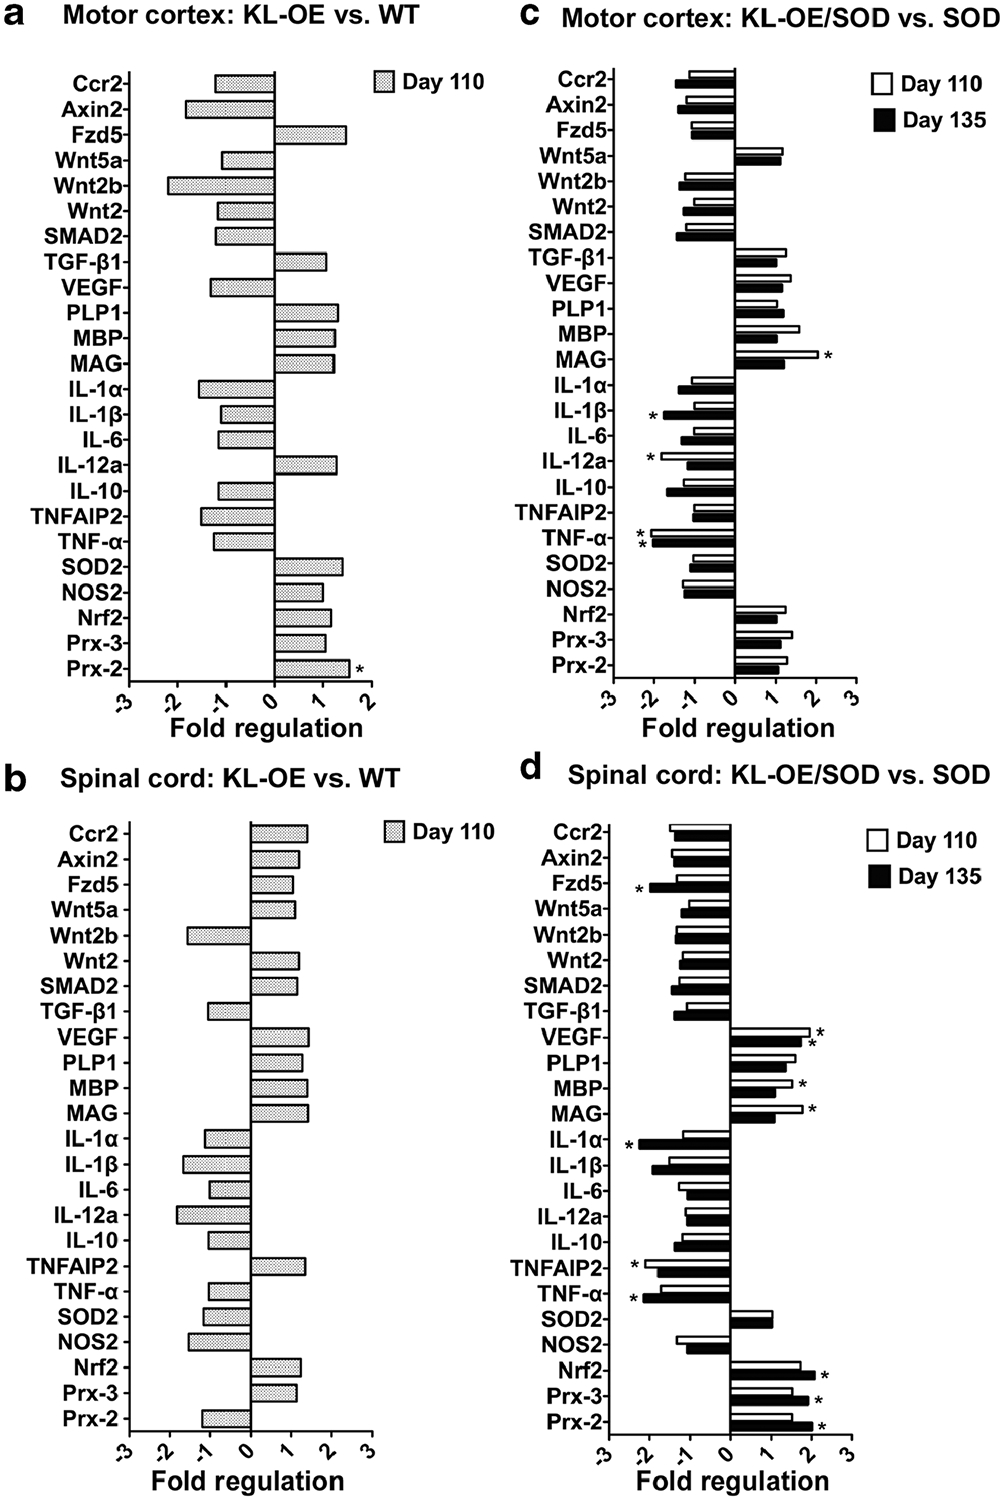
Fig. 5.

Analysis of the Klotho-induced changes in gene expression in the motor cortex (a, b) and lumbar spinal cord (c, d). The effect of Klotho overexpression in WT (a, c) and SOD1 mice (b, d) on mRNA expression of specific genes was measured using TaqMan gene expression assays (see Table 2) at 110 days (a–d) and 135 days (b, d). Bars represent fold difference (n = 6). The asterisks indicate statistical significance, *p value < 0.05 as analyzed by Bio-Rad CFX Manager 3.1 software
