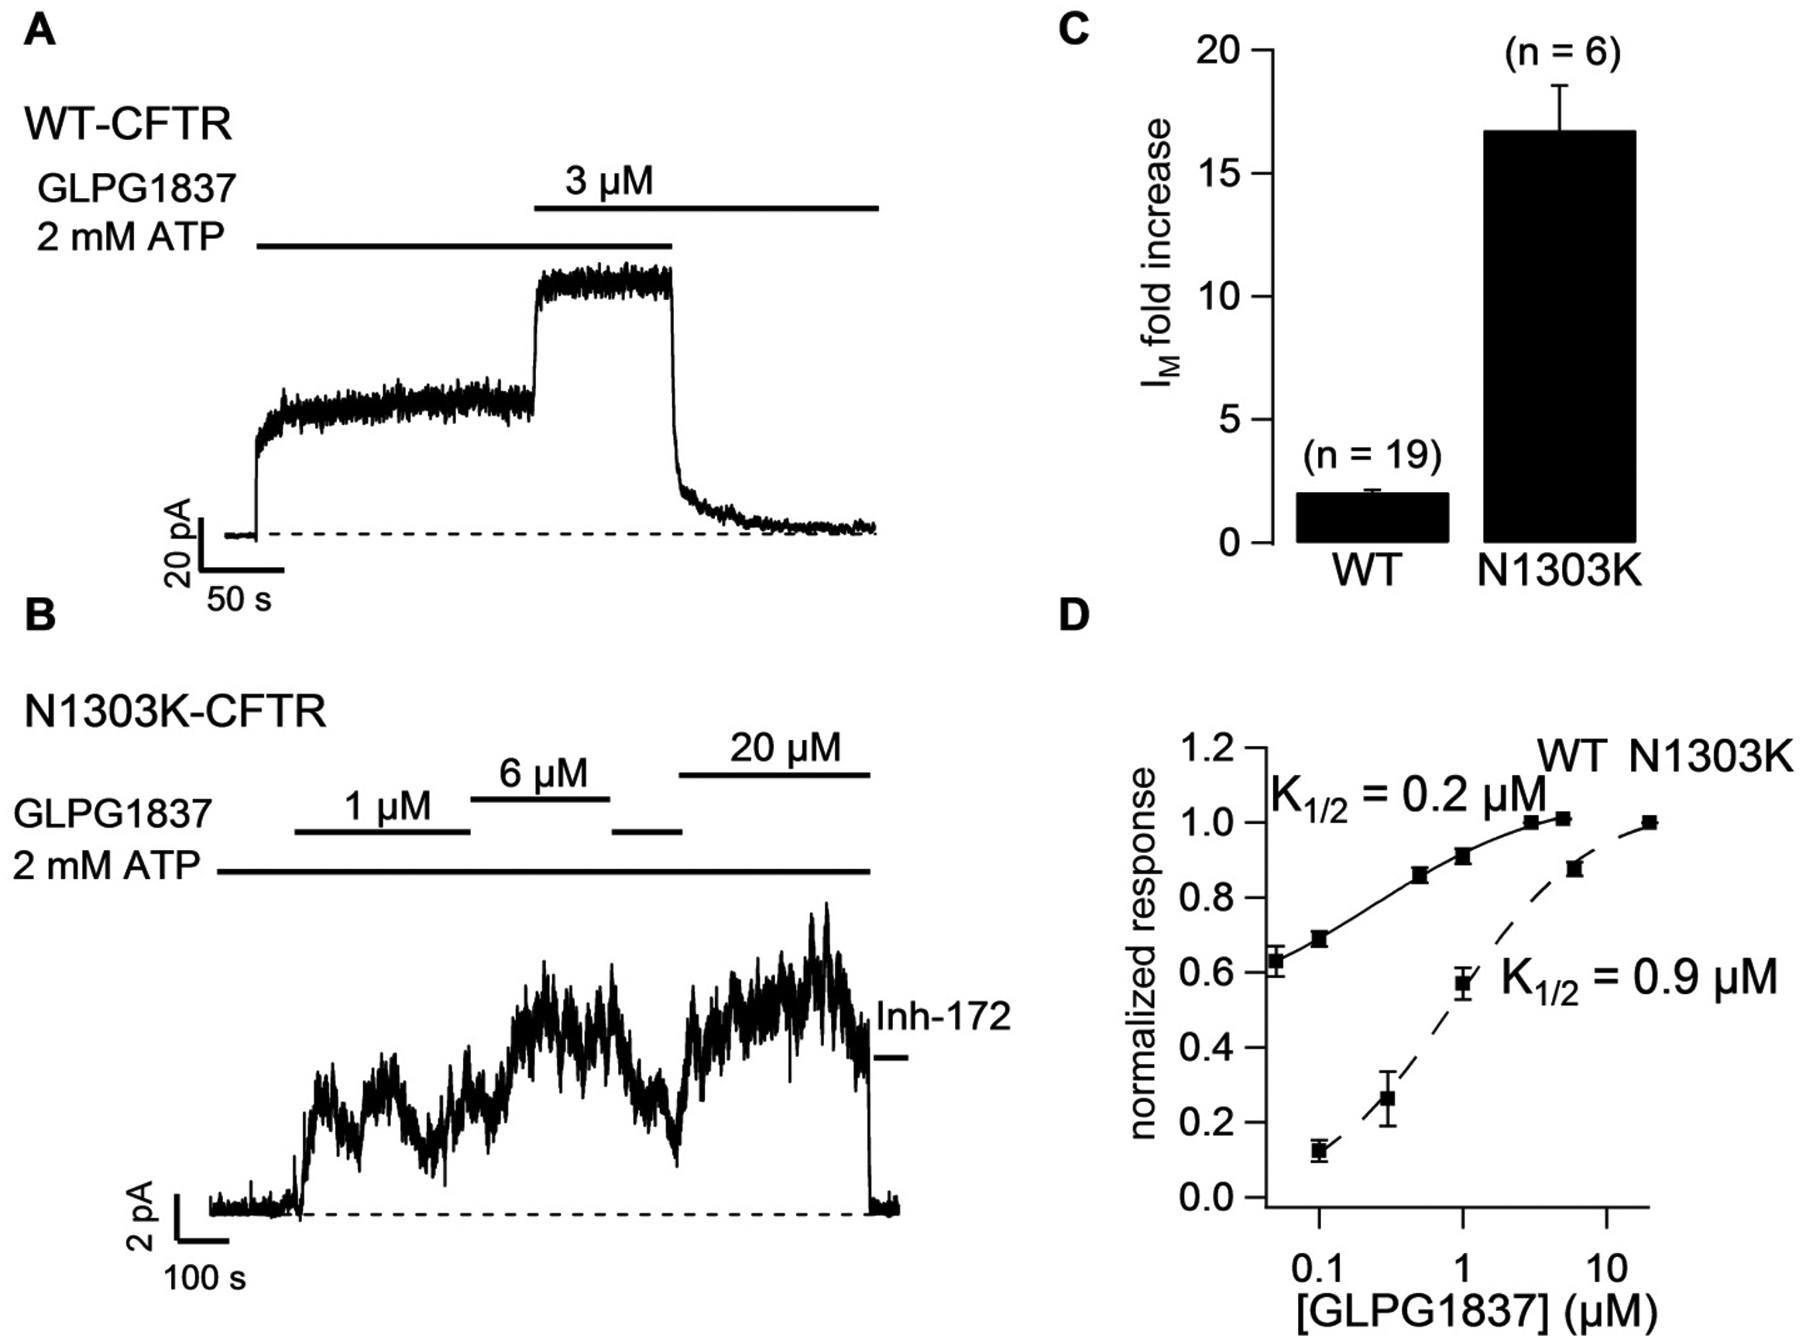
Fig. 1.

Macroscopic recordings of WT-CFTR (A) or N1303K-CFTR (B) showing response to potentiator GLPG1837. Channels were prephosphorylated with PKA + ATP and then exposed to GLPG1837. The bars indicate the presence of ATP, GLPG1837 and CFTRinh-172 (Inh-172) in the intracellular solution and the dashed lines represent the baseline. N1303K channel currents increase 16.8-fold ± 1.8 (n = 6) in response to a saturating concentration of GLPG1837, indicating a PO for N1303K < 0.06. (C) Quantification of the fold increase in mean current (IM) in response to saturating concentrations of GLPG1837. (D) GLPG1837 concentration response curves (n = 3 – 8 for each data point). The dose response curve is shifted to the right for N1303K-CFTR (K1/2 = 0.9 μM cf. 0.2 μM for WT). Note data on WT-CFTR are extracted from ref. [20].
