
Figure 4.
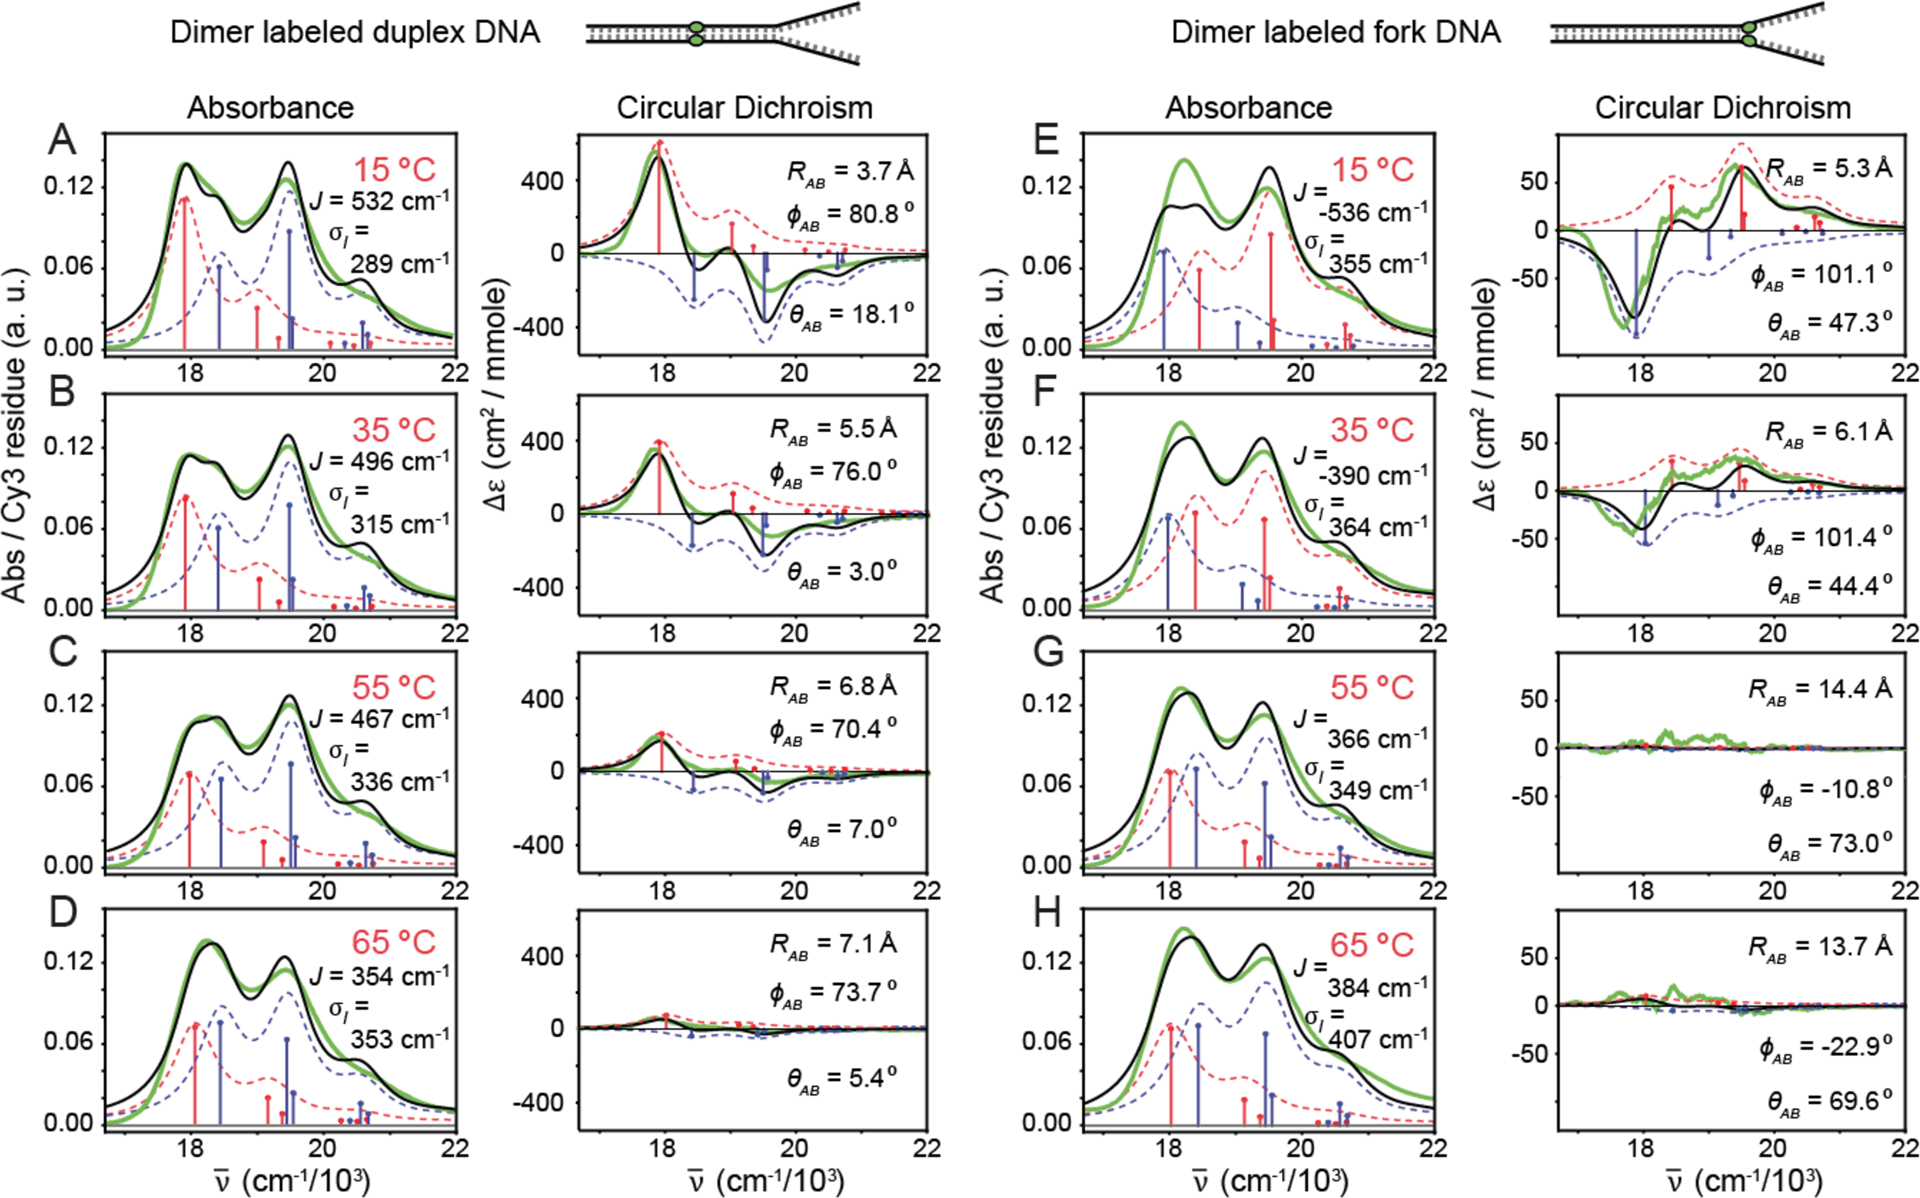
Temperature-dependent absorbance and CD spectra for (Cy3)2 dimer labeled duplex DNA construct (A-D), and for the (Cy3)2 dimer labeled fork DNA construct (E-H). Experimental spectra are shown in solid green, and the simulated total lineshapes (inhomogeneous-plus-homogeneous) are shown in solid black. The optimized parameters shown in the insets were obtained using the extended-dipole model for the resonant coupling. Symmetric and anti-symmetric transitions determined from the model are shown as blue and red sticks, respectively. Symmetric and anti-symmetric contributions to the inhomogeneous lineshapes are shown as dashed blue and red curves, respectively.