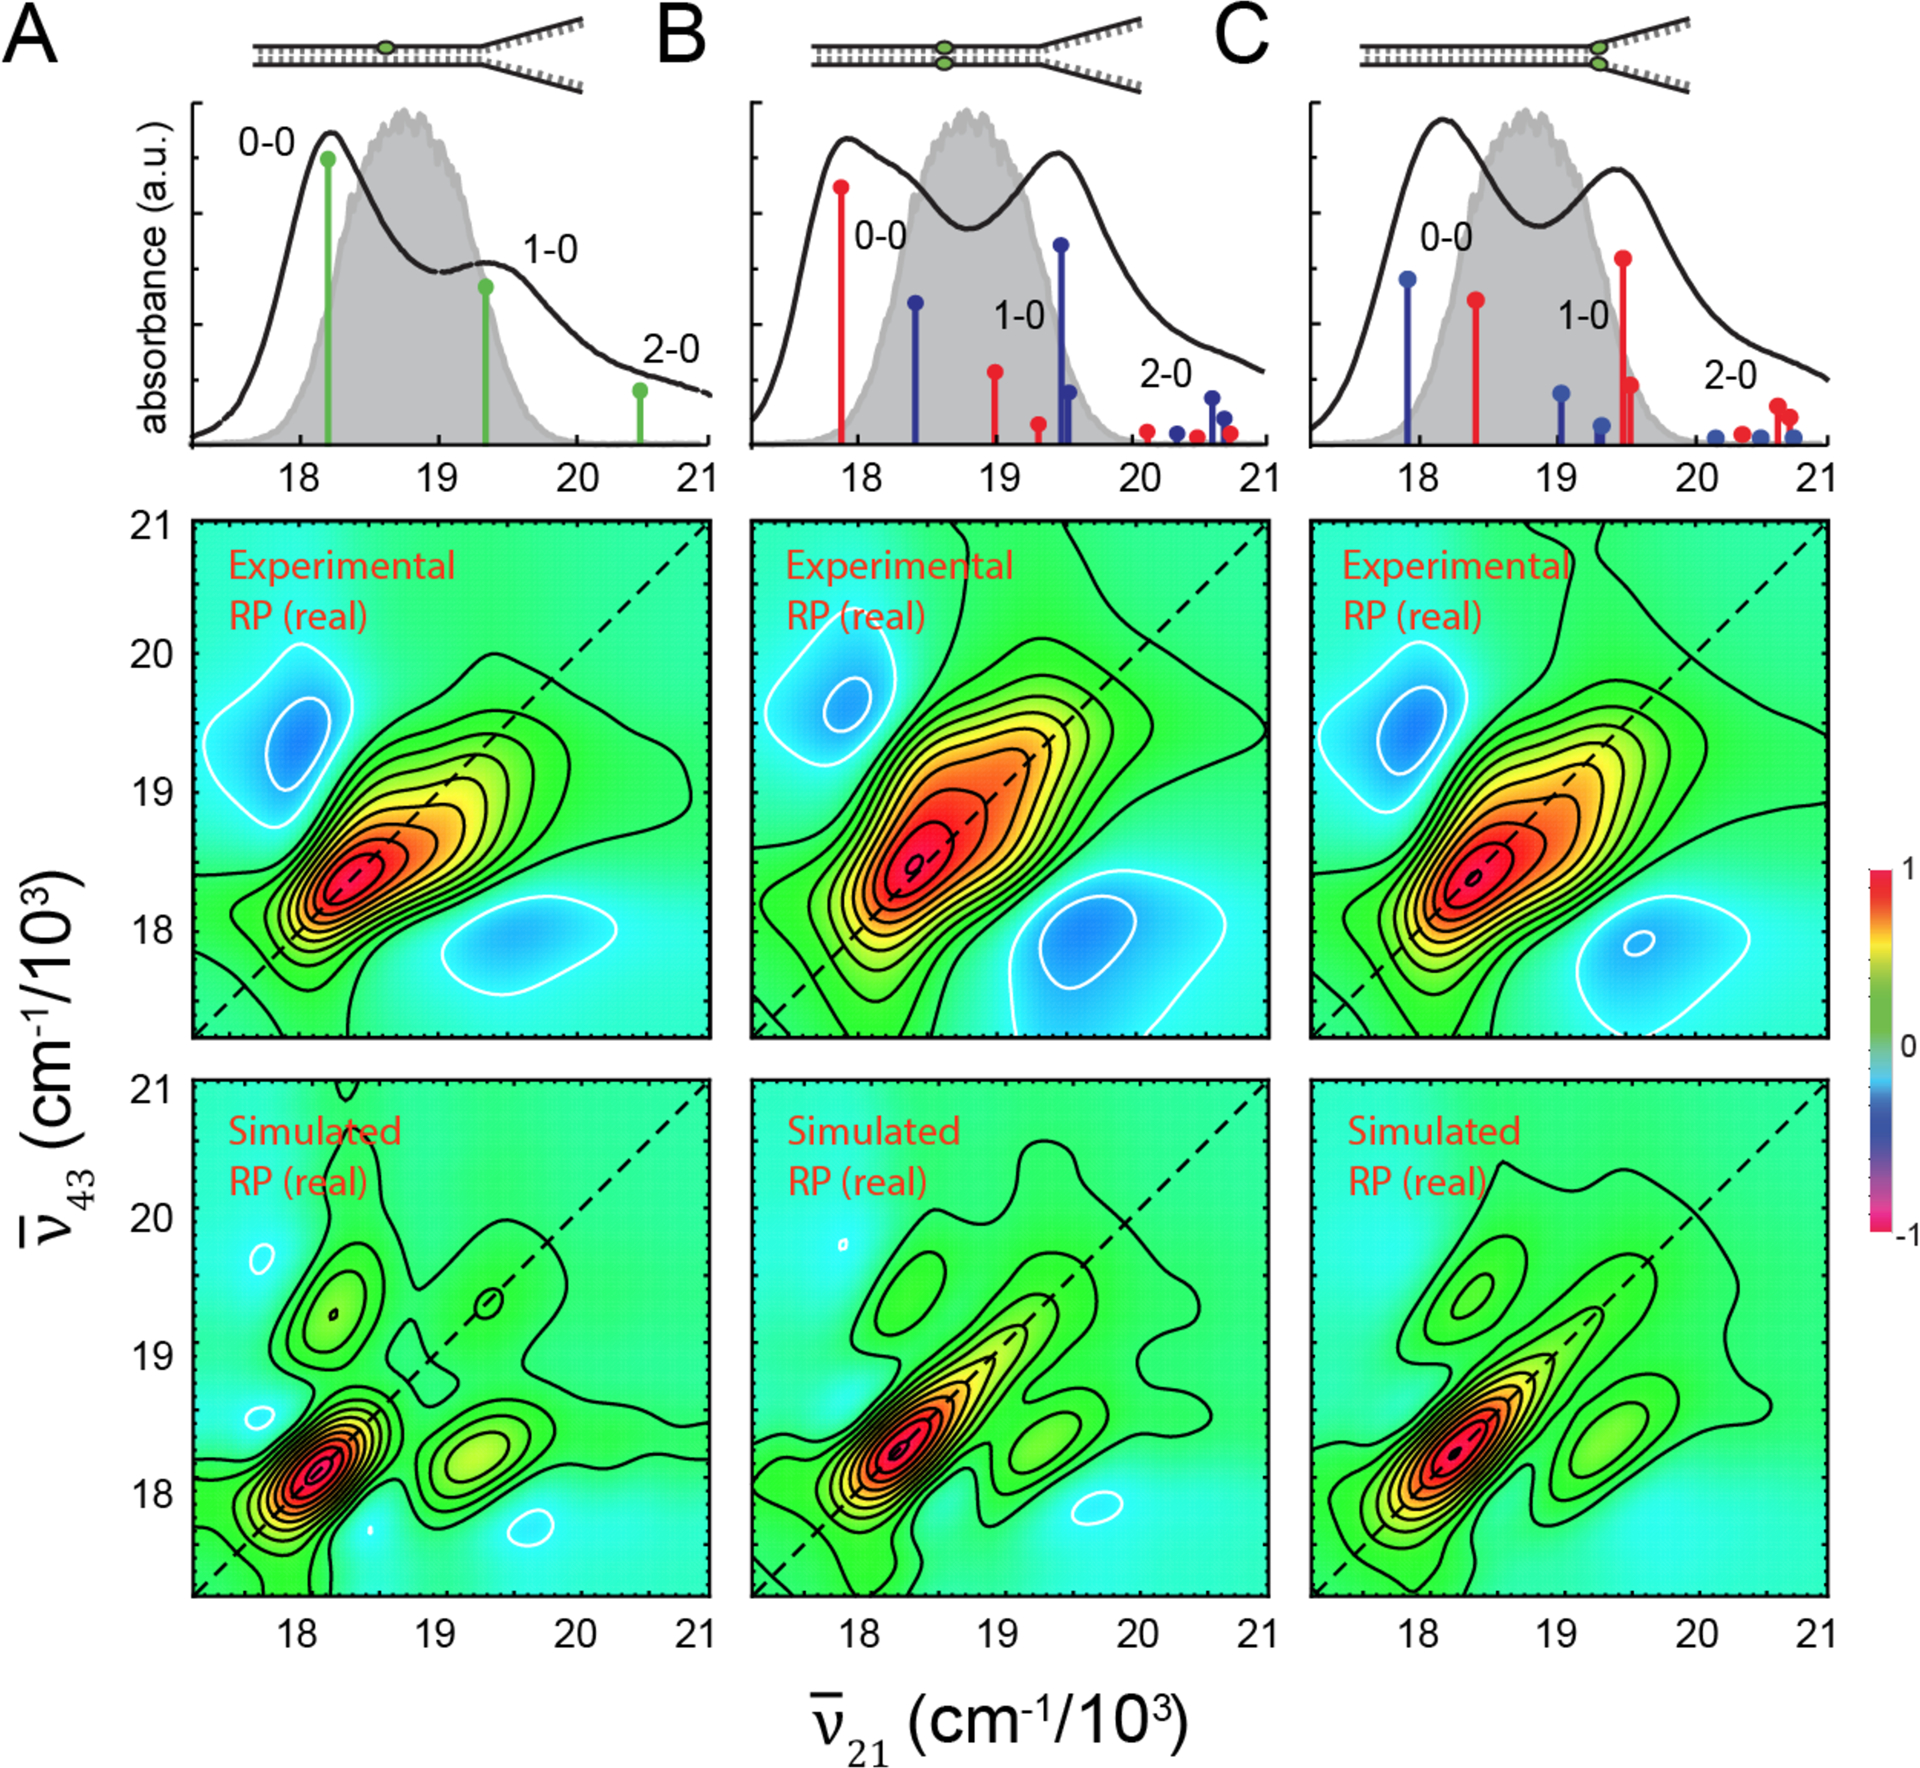
Figure 6.

Room temperature (25 °C) experimental and simulated 2DFS measurements performed on (A) the Cy3 monomer duplex DNA construct, (B) the (Cy3)2 dimer duplex DNA construct, and (C) the (Cy3)2 dimer fork DNA construct. Absorbance spectra are shown overlaid with the vibronic spectral features obtained from the H-F Hamiltonian given by Eq. (1) and Eq. (2). The associated parameters are listed in Table S1 for the monomer duplex DNA construct, in Table II for the dimer duplex DNA construct, and in Table III for the dimer fork DNA construct. Also shown is the laser spectrum (in gray) with center frequency = 18,796 cm−1 (λL= 532 nm) and FWHM bandwidth = 1,100 cm−1 (ΔλL = 31 nm). The laser spectrum spans a region containing both the 0–0 and 1–0 vibronic sub-bands. Experimental RP spectra (middle row) are compared to simulated RP spectra (bottom row). Simulated spectra are based on the homogeneous line width parameter ΓH = 186 cm−1, the fluorescence quantum yield parameter Γ2D = 0.5 [Eq. (6)], the structural parameters obtained from our analyses of absorbance and CD spectra, and inhomogeneous lineshape parameters (A) σI = 125 cm−1, (B)σI = 125 cm−1 and (C) σI = 250 cm−1.
