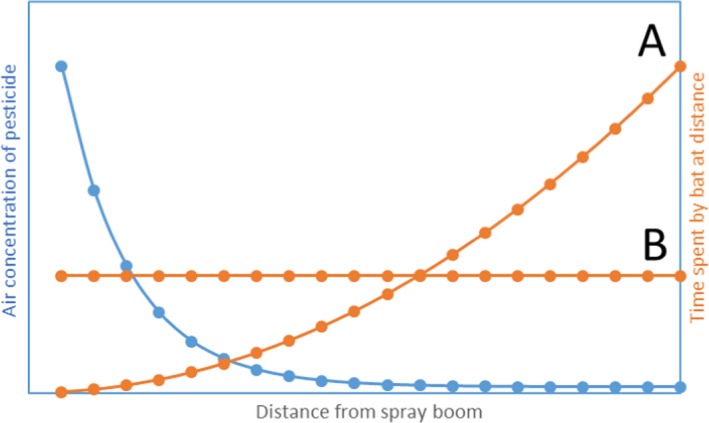
Figure 2.

Hypothetical curves for air concentration of pesticide behind the boom with distance and time spent by bats at distance behind the boom. A and B are the curves for two different flight patterns of bats. A flies most of the time at a larger distance from the spray boom and only for short times close to the spray boom while B flies continuously at a certain distance from the spray boom
