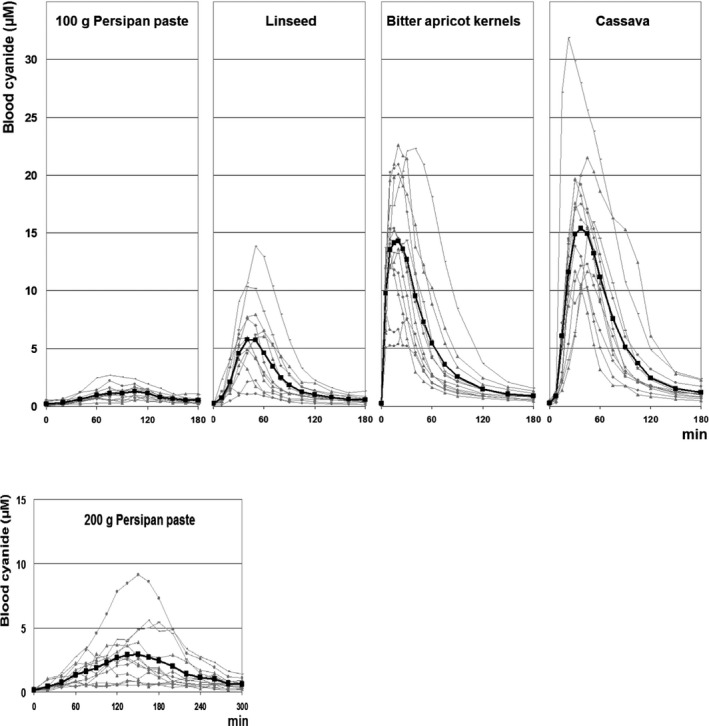
Figure C.1.

Individual and mean (in bold) concentration–time curves observed after ingestion of the four foods (persipan paste, apricot kernels, linseed, cassava) (taken from Abraham et al., 2016)

Individual and mean (in bold) concentration–time curves observed after ingestion of the four foods (persipan paste, apricot kernels, linseed, cassava) (taken from Abraham et al., 2016)