Figure 3.

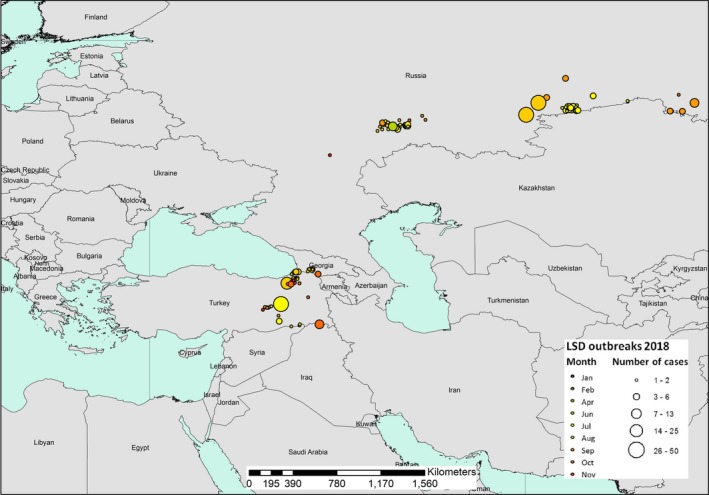
Temporal distribution of the LSD outbreaks by month (coloured bubbles) in 2018. The number of cases reported in each outbreak is proportional to the size of the bubble. (Data source: Empres‐I and ADNS)

Temporal distribution of the LSD outbreaks by month (coloured bubbles) in 2018. The number of cases reported in each outbreak is proportional to the size of the bubble. (Data source: Empres‐I and ADNS)