
Figure 3.
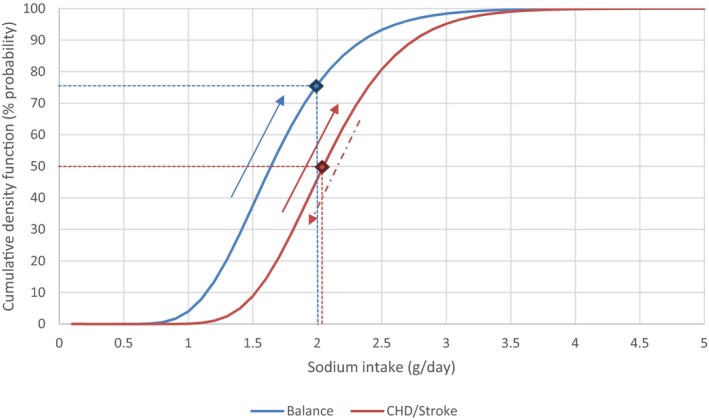
Cumulative uncertainty density functions
- Log‐normal distributions were fitted to the empirical uncertainty probability distributions elicited through the two EKEs and used to derive the two cumulative density functions depicted above.
- The red curve is the cumulative density function corresponding to the elicitation of the lowest level of sodium intake at which the risk of chronic disease (i.e. stroke, CHD) is minimised in the general population. As one goes towards the right of the curve, the uncertainty that the identified range includes the level of sodium intake that ‘minimises’ the risk of CHD increases; similarly, as one moves towards the left, the uncertainty that the identified range includes the level of sodium intake that ‘minimises’ the risk of stroke increases. The curve integrates experts’ considerations about the strength of the evidence for the respective outcomes and associated uncertainties. At the median level of the distribution (red dot), there is equal certainty that the level of sodium that it is associated with a reduction of CVD risk is neither overestimated (50% probability) nor underestimated (50% probability). So, the Panel considers that there is sufficient confidence in the data that a sodium intake of 2 g/day is associated with a reduction of CVD risk.
- The blue curve is the cumulative density function corresponding to the elicitation of the lowest level of sodium intake that allows to maintain sodium balance for most of the general population. The curve represents the probability/certainty that the ‘lowest level of sodium intake that is adequate (i.e. to maintain sodium balance) for the majority (≥ 97.5%) general population of adults’ is any value from the lower bound of the range up to the identified value. The interpretation of the curve is unidirectional: as one goes towards the right, the confidence (certainty) that the identified range includes the level of sodium intake that is adequate increases. The Panel considers that a level of sodium intake of 2 g/day (blue dot) is likely (i.e. with a 75% probability) to be adequate to maintain sodium balance for most of the general adult population in the EU.
- The curves do NOT represent the probability (or risk) of given outcome (i.e. CVD disease, sodium ‘imbalance’) associated with a given level of sodium intake.