
Figure I.1.
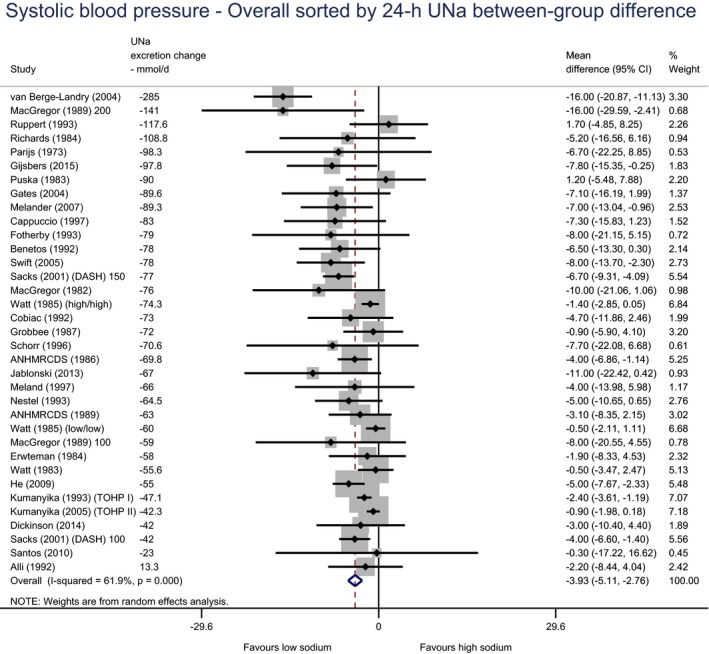
sbp – all adults, sorted by 24‐h UNa between‐group difference
- 95% CI: 95% confidence interval; UNa: sodium urinary excretion.
Official websites use .gov
A
.gov website belongs to an official
government organization in the United States.
Secure .gov websites use HTTPS
A lock (
) or https:// means you've safely
connected to the .gov website. Share sensitive
information only on official, secure websites.
sbp – all adults, sorted by 24‐h UNa between‐group difference