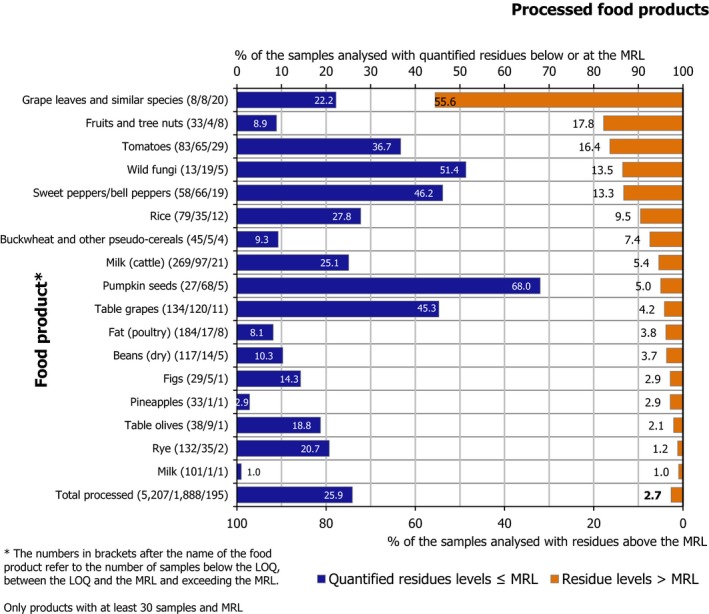
Figure 50.

MRL exceedance rate and quantification rate for processed food products (excluding baby foods), sorted by decreasing MRL exceedance rate

MRL exceedance rate and quantification rate for processed food products (excluding baby foods), sorted by decreasing MRL exceedance rate