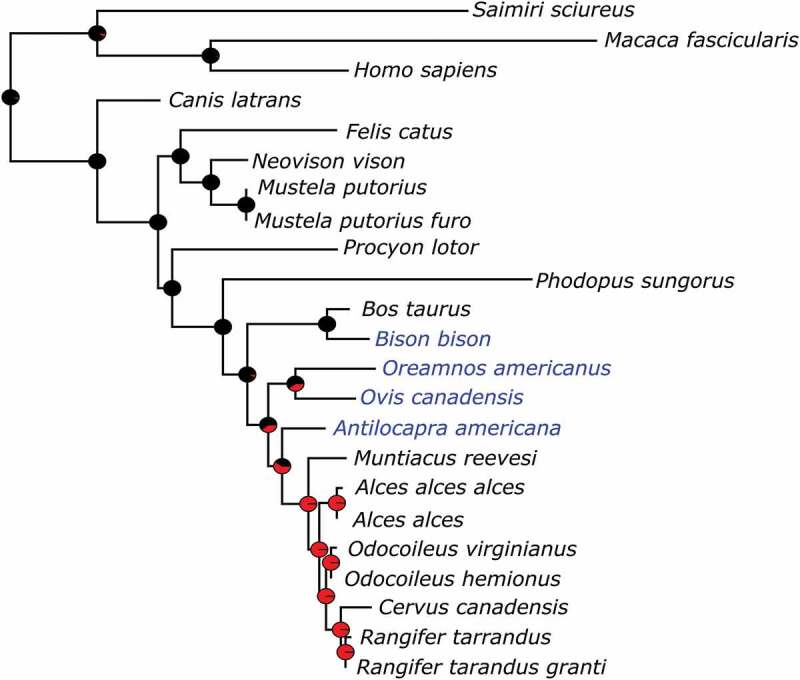
Figure 2.

Maximum likelihood phylogram of cytochrome b genes with taxa for species with known (species names in black) and unknown (species names in blue) CWD susceptibility. Pie charts at nodes indicate predicted ancestral resistance (black colouring) or susceptibility (red colouring).
