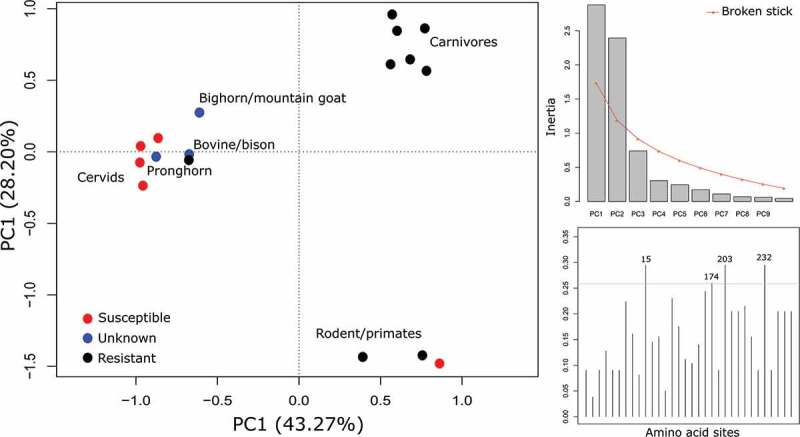
Figure 3.

Principle component analysis of amino acids sites that are variable between species that are resistant and susceptible to CWD, with unknowns included. The plot on the top right is a scree plot showing the first two axes are significant and explain most of the variation in the data. The bottom right plot is the loadings of the amino acid sites on the first axis, the top 10% are labelled. The scree plot and loadings plot are based on only the resistant and susceptible data (biplot not shown).
