Figure 6.

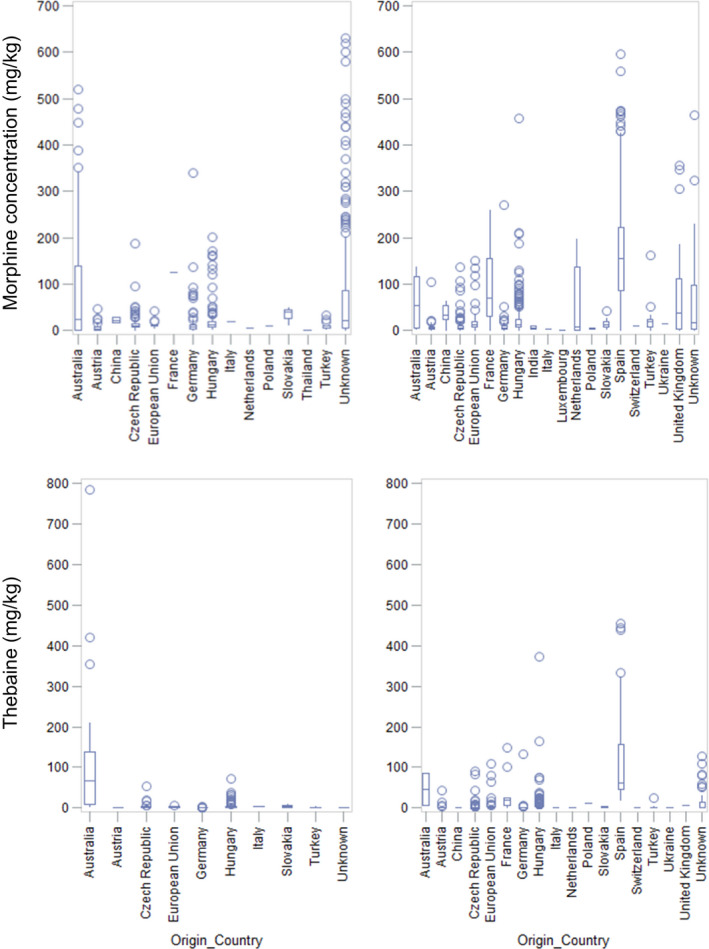
Box plots representing the upper bound concentration (mg/kg whole weight) of morphine (top) and thebaine (down) in poppy seed samples according to country of origin for the 1st (left) and 2nd batch (right) of data

Box plots representing the upper bound concentration (mg/kg whole weight) of morphine (top) and thebaine (down) in poppy seed samples according to country of origin for the 1st (left) and 2nd batch (right) of data