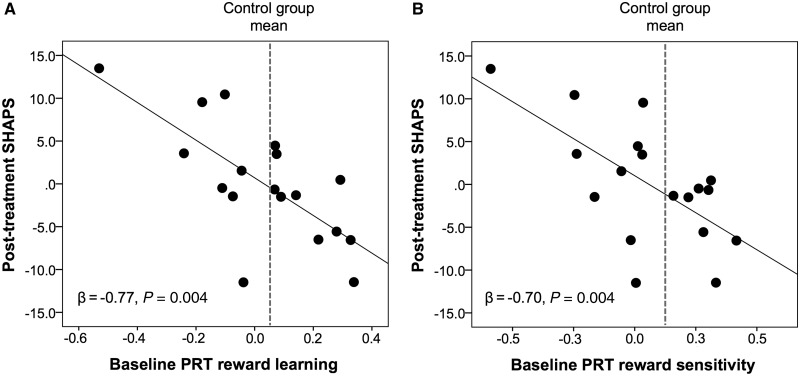
Figure 2.
Baseline reward learning and reward sensitivity predict post-treatment anhedonia. Partial regression plots showing that (A) better baseline reward learning and (B) greater baseline reward sensitivity (as assessed using computational modelling) on the Probabilistic Reward Task (PRT) predicted lower post-treatment anhedonia (as assessed by the SHAPS) after controlling for baseline SHAPS scores. For visualization purposes, the grey dashed line shows the healthy control group mean and indicates that patients with scores equal to or greater than the control group mean (i.e. those with relatively more normative scores) showed the lowest post-treatment anhedonia.

