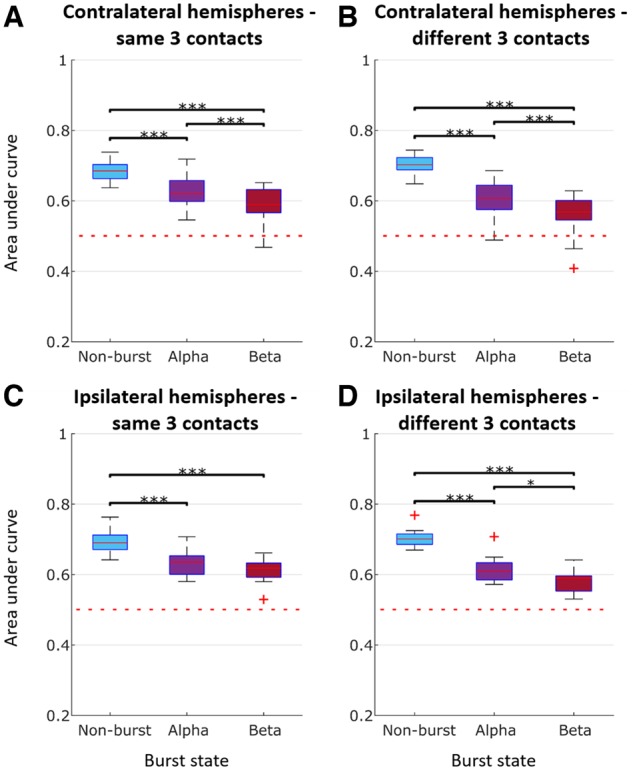
Figure 6.

Classification AUC during the pre-cue period for different burst conditions [alpha (8–12 Hz), beta (13–30 Hz), and non-burst]. (A) Average across all contralateral hemispheres (n = 23) for same best three contacts (i.e. the three contacts affording the best predictions as measured by the AUC). (B) Average across all contralateral hemispheres (n = 23) for different best three contacts. (C) Average across all ipsilateral hemispheres (n = 13) for same best three contacts. (D) Average across all ipsilateral hemispheres (n = 13) for different best three contacts. ***P < 0.001. Box and whisker plots with median (red horizontal line), 25th and 75th percentiles (bottom and top edges of the box, respectively), and outliers (red+) noted. Horizontal dashed red line shows the AUC if classification were at chance level.
