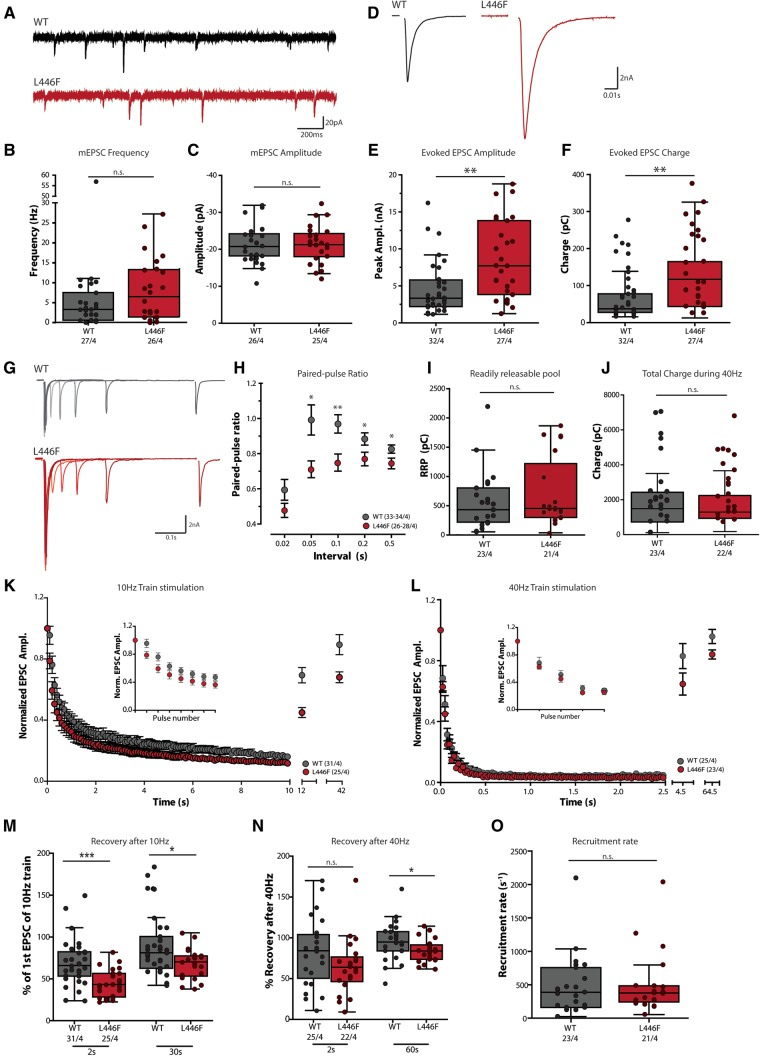
Figure 3.
Patch-clamp electrophysiological characterization of Munc18-1 null neurons expressing Munc18L446F. (A–C) Spontaneous release of synaptic vesicles is not significantly altered by expression of Munc18L446F. (A) Example traces of spontaneous release of single synaptic vesicles (mEPSCs) of Munc18-1 null neurons expressing Munc18WT or Munc18L446F. (B and C) No differences are observed in spontaneous mEPSC frequency (B: Munc18WT median = 3.253 Hz, IQR = 0.584–7.49; Munc18L446F median = 6.473 Hz, IQR = 1.375–13.25; P = 0.165, Mann-Whitney U-test) and amplitude (C: Munc18WT median = −20.76 pA, IQR = −24.19–18.24; Munc18L446F median = −21.28 pA, IQR = −24.29–18.03; P = 0.943, unpaired t-test) between Munc18WT and Munc18L446F. (D–F) Evoked synaptic responses are increased in neurons expressing Munc18L446F. (D) Typical examples of a single evoked EPSC. Stimulus artefact has been blanked out for visualization purposes. (E) Average EPSC amplitude is significantly larger in neurons expressing Munc18L446F compared Munc18WT (Munc18WT median = 3.332 nA, IQR = 2.213–5.798; Munc18L446F median = 7.716 nA, IQR = 3.838–13.81; P = 0.0018, Mann-Whitney U-test) and in parallel, the average charge (F) transferred during the EPSC response is increased (Munc18WT median = 37.36 pC, IQR = 27.65–77.65; Munc18L446F median = 117.0 pC, IQR = 43.69–164.7; P = 0.0012, Mann-Whitney U-test). (G and H) Paired-pulse recordings at various intervals were performed to quantify release probability. (G) Example traces showing an overlay of paired-pulse recordings at several time intervals (20–50–100–200–500 ms interpulse interval) for a neuron expressing Munc18WT or Munc18L446F. (H) Paired-pulse ratios (calculated as the ratio of the second EPSC to the first EPSC) are significantly higher for neurons expressing Munc18L446F at the stimulus intervals between 0.05 and 0.5 s (0.02 s: Munc18WT median = 0.488, IQR = 0.363–0.880; Munc18L446F median = 0.479, IQR = 0.317–0.657, P = 0.109, unpaired t-test with Welch’s correction; 0.05 s: Munc18WT median = 0.872, IQR = 0.689–1.198; Munc18L446F median = 0.701, IQR = 0.544–0.849, P = 0.0103; 0.1 s: Munc18WT median = 0.913, IQR = 0.743–1.157; Munc18L446F median = 0.732, IQR = 0.589–0.891, P = 0.0045; 0.2 s: Munc18WT median = 0.873, IQR = 0.754–0.955, Munc18L446F median = 0.777, IQR = 0.625–0.866, P = 0.0207; 0.5 s: Munc18WT median = 0.833, IQR = 0.775–0.905, Munc18L446F median = 0.751, IQR = 0.614–0.839, P = 0.019, Mann-Whitney U-tests). (I) Estimate of the RRP by back-extrapolation indicates no difference in RRP size between Munc18WT or Munc18L446F (Munc18WT median = 432.7 pC, IQR = 220.1–803.6, Munc18L446F median = 455.4 pC, IQR = 300.3–1219, P = 0.511, Mann-Whitney U-test). (J) Total charge transferred during the 40-Hz train stimulation is not significantly different between Munc18WT or Munc18L446F (Munc18WT median = 1488 pC, IQR = 724.4–2424, Munc18L446F median = 1296 pC, IQR = 939.0–2239, P = 0.594, Mann-Whitney U-test). (K) Run-down kinetics and steady-state responses to 100 action potentials at 10 Hz are similar between Munc18WT and Munc18L446F, except for the first few pulses (inset) at which neurons expressing Munc18L446F display more pronounced depression compared to Munc18WT. (L) EPSC rundown in response to a stimulation of 100 action potentials at 40 Hz are also similar between Munc18WT and Munc18L446F. Inset: first five pulses of the train. (M) EPSC amplitude in response to single action potential stimulations 2 and 30 s after the 10-Hz train stimulation expressed as a percentage of the amplitude of the first EPSC of the train stimulation. Neurons expressing Munc18L446F have a smaller EPSC response at 2 s (Munc18WT median = 65.96%, IQR = 53.26–82.32, Munc18L446F median = 43.27%, IQR = 28.32–56.44, P = 0.0003, Mann-Whitney U-test) and 30 s (Munc18WT median = 81.15%, IQR = 62.58–100.6, Munc18L446F median = 70.29%, IQR = 53.31–77.36, P = 0.021, Mann-Whitney U-test) after a 10-Hz train. (N) Recovery of the RRP was measured at 2 and 60 s after the train, respectively. After 2 s, recovery is not significantly different but shows a trend towards a reduction in Munc18L446F expressing neurons (Munc18WT median = 84.22%, IQR = 50.45–104.0, Munc18L446F median = 63.92%, IQR = 46.39–76.59, P = 0.068, Mann-Whitney U-test). Sixty seconds after 40-Hz stimulation, neurons expressing Munc18WT show full recovery whereas recovery is impaired in neurons expressing Munc18L446F (Munc18WT median = 94.90%, IQR = 83.97–107.5, Munc18L446F median = 83.93%, IQR = 73.73–91.31, P = 0.0396, unpaired t-test with Welch’s correction). (O) Recruitment rate of vesicles at steady-state during 40 Hz stimulation as estimated by the back-extrapolation procedure (C) is not different between Munc18WT or Munc18L446F (Munc18WT median = 388.5 s−1, IQR = 160.7–755.8, Munc18L446F median = 377.3 s−1, IQR = 243.4–484.4, P = 0.778, Mann-Whitney U-test). The number of analysed cells and number of independent cultures tested is indicated below the graphs. *P < 0.05, **P < 0.01.

