
Figure 24.
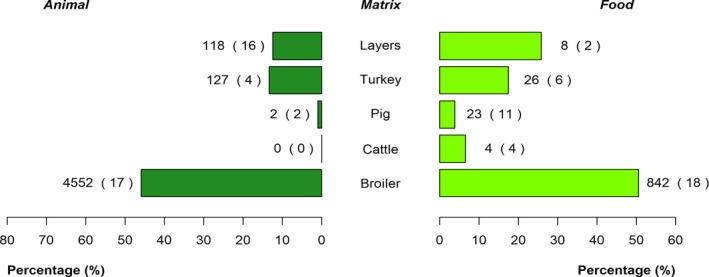
Pyramid plot showing the distribution of S. Infantis among food and animal sources, EU, 2017
- The percentages were calculated on the total number of isolates serotyped for each animal and food category. The values at the side of each bar are the number of S. Infantis isolates and the number in parentheses indicates the number of reporting Member States.