
Figure 30.
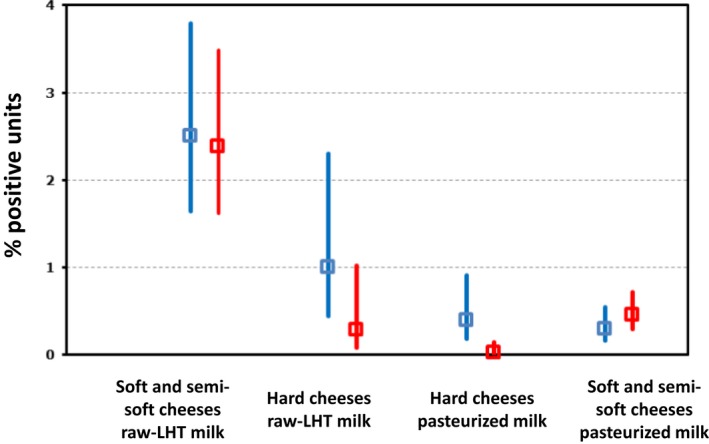
Proportion of L. monocytogenes‐positive sampling units in cheeses in 2017 (red) and in 2016 (blue) across all sampling stages (overall), retail and processing plant levels
- LHT: low‐heat‐treated. ‘Overall’ and the number of MS correspond to data across all sampling stages (‘retail’ and ‘processing’ + ‘farm’ + ‘border inspection activities’ + ‘unspecified’).For each sampling stage (‘overall’, ‘retail’ and ‘processing’), data are pooled across both types of sampling units (‘single’ and ‘batch’). Soft and semi‐soft cheeses as well as hard cheeses include all cheeses for which Level 2 at matrix level was specified (‘fresh’ or ‘soft’ or ‘semi‐soft’ or ‘hard’).