
Figure 32.
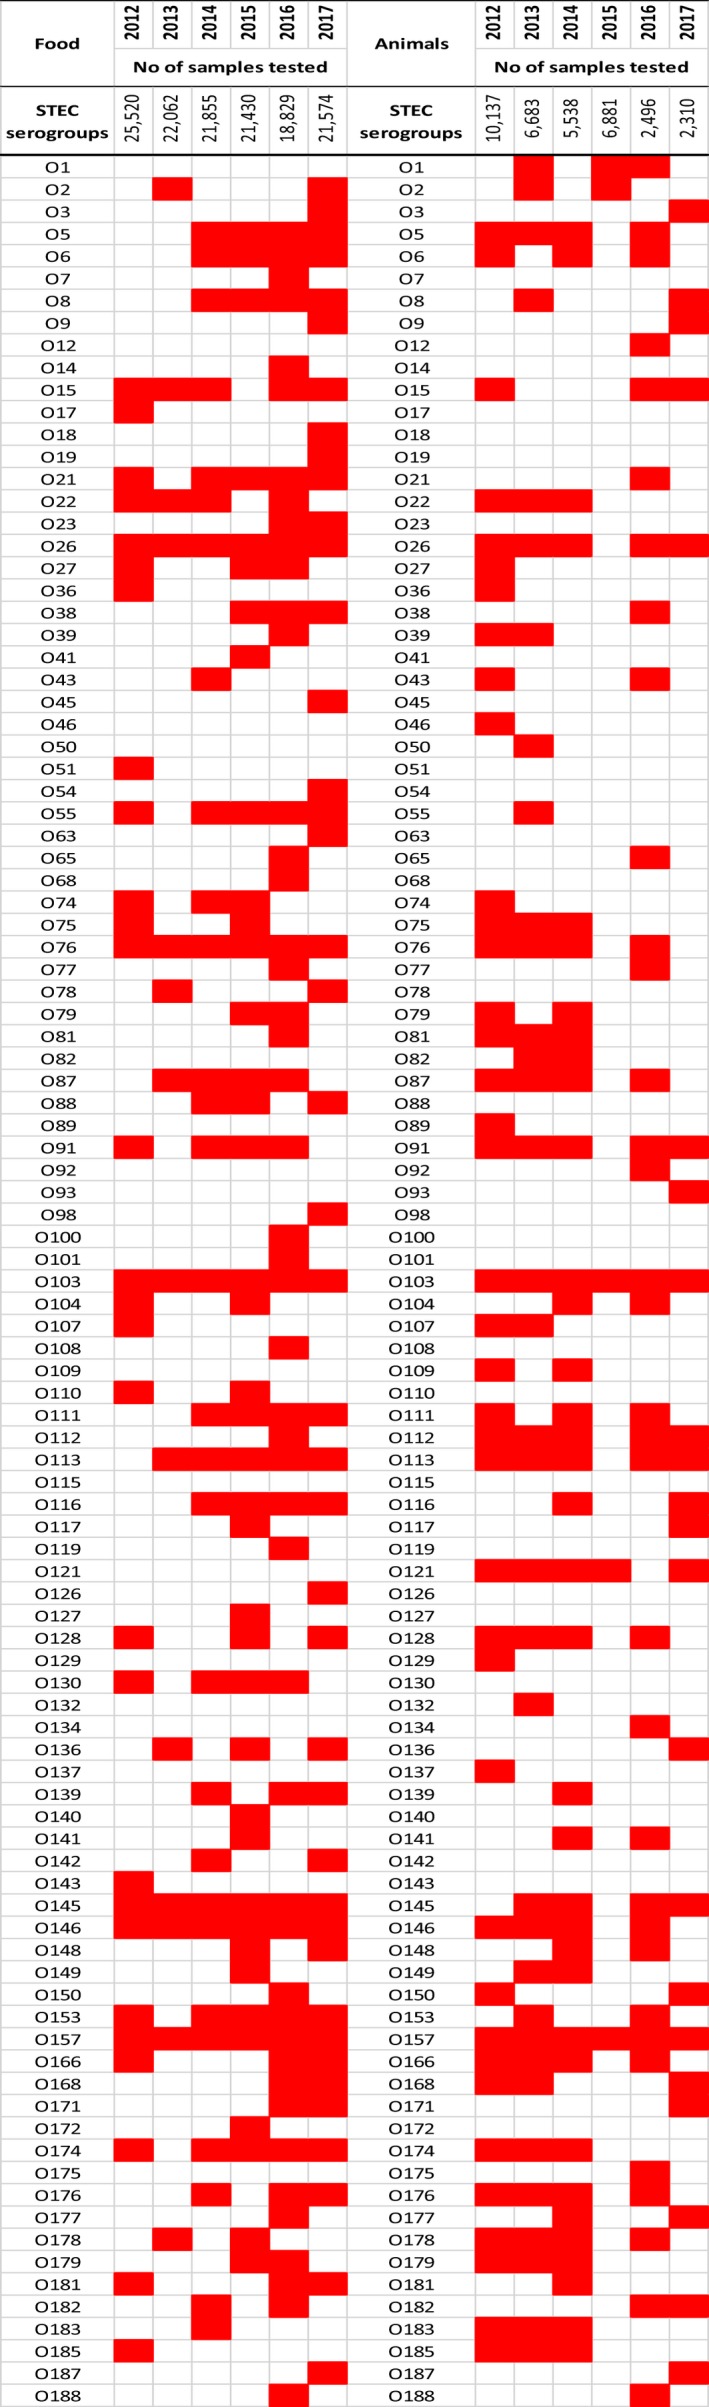
Frequency distributions of reported STEC serogroups in food and animals, in reporting Member States and non‐Member States, during 2012 and 2017
- Note: The presence (red boxes) and absence (white boxes) of STEC serogroups in food (left) and animals (right). The E. coli O104:H4 stx2+ eae‐ was isolated from sprouted seeds in 2015. No information was provided on the H type and genotype of the E. coli O104 strains isolated from food in 2012.