
Figure 33.
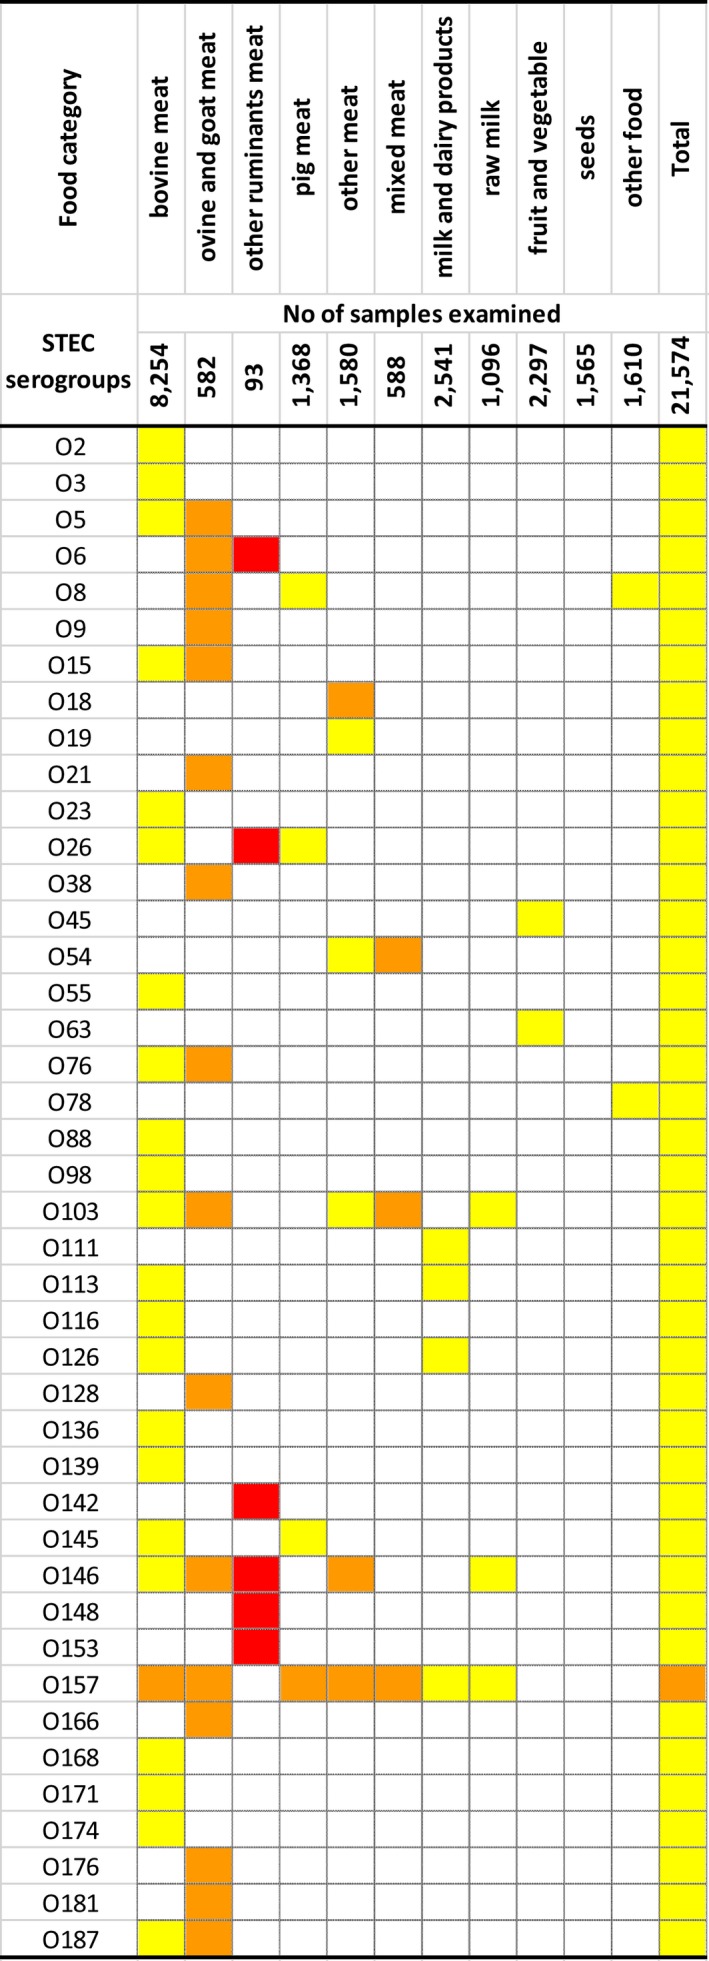
Relative presence of reported STEC serogroups in food, in reporting Member States and non‐Member States, 2017
- Proportions of STEC serogroups: red boxes > 1%, orange boxes > 0.1% and ≤ 1%, yellow boxes > 0.0001% and ≤ 0.1% of positive samples. White boxes indicate absence of the serogroup.
- Other ruminants’ meat includes meat from deer.
- Other meat includes meat from animals other than ruminants.
- Milk and dairy products include any type of dairy product, cheese and milk other than raw milk.
- Raw milk includes raw milk from different species, but most of the tested and all the positive samples were from cows.
- Seeds category includes mostly sprouted seeds, but dry seeds are also included.
- Sources: 25 Member States.