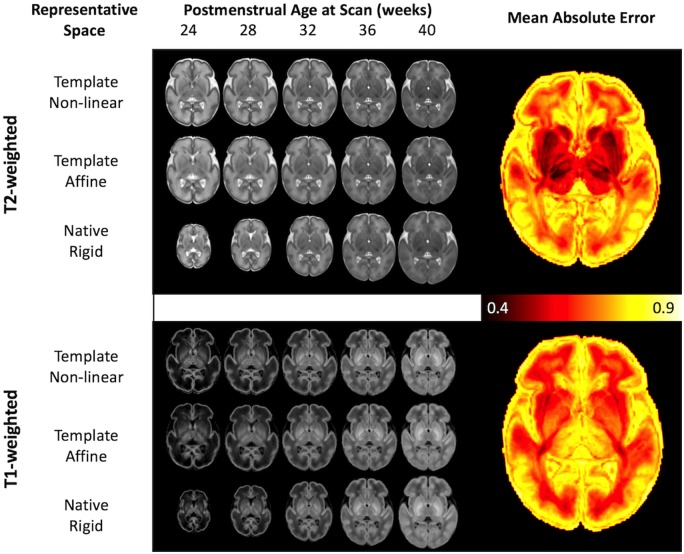
Figure 3.
Model predictions of image shape and intensity over age. Intensity, shape and native space models visualized for each of T2- and T1-weighted modalities at fixed PMA, assuming age at birth is 1 week prior to scan. The top row for each shows the intensity model in template space (after removing global and local shape changes), the middle row after deforming the standard space image back to a representative affine space (only global changes have been removed), and the bottom row shows the expected image in native space (where the image represents the expected shape, size and intensity of a neonate at that age. The mean absolute error of the prediction of T1 and T2-weighted image intensity is shown in the images on the right, in units of input data standard deviation. These curves are represented as an animation in Supplementary Videos 1–6.

