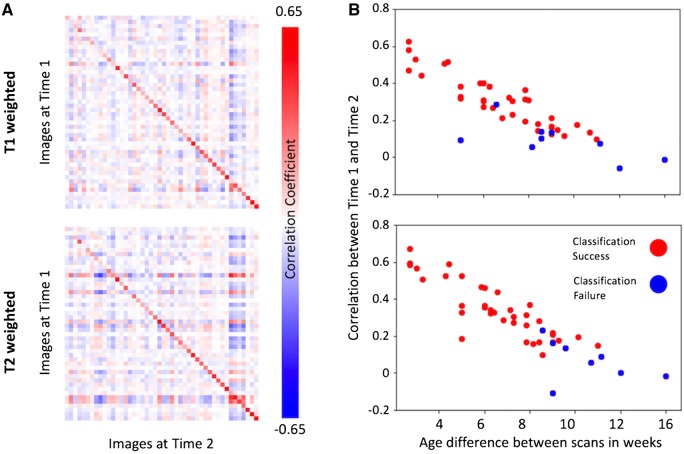
Figure 4.
Longitudinal consistency of model deviations. In longitudinal data, individual neonates are more similar to themselves in the spatial pattern of their individual differences with respect to the model prediction than other infants (A). Pearson’s correlation coefficient matrix between the model deviations of each pair of images (n = 46) at Time 1 against all follow-up scans at Time 2, with the images on both axes ordered according to PMA at each scan time. Comparing to the whole cohort of 408 neonates, 35/46 infants are most correlated to themselves at Time 1 on T1-weighted images, and 38/46 on T2-weighted. The larger the difference in age between scans (B), the less similar the images are between two time points from the same individual. Red dots indicate classification successes and blue failures (can Time 1 be identified from Time 2 across all 408 training datasets?).

