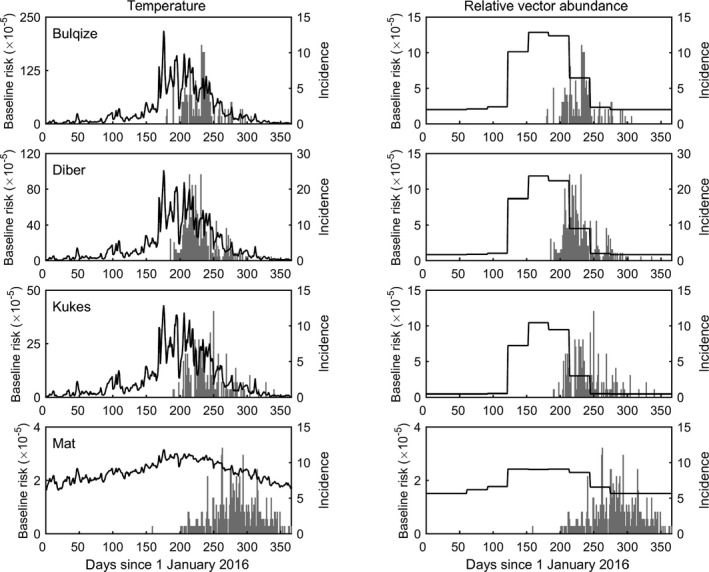
Figure 12.

Estimated seasonal variation in the baseline risk of transmission of LSDV between farms for four districts in Albania in 2016. Seasonality is incorporated either via temperature dependence (left‐hand column) or relative abundance of S. calcitrans, a putative vector of LSDV (right hand column). Each plot shows the posterior median for the baseline risk over time (black line, left‐hand y axis) and the daily incidence of newly reported farms (grey bars, right hand y axis)
